The Top 16 UK Cities for 2G, 3G and 4G Mobile Network Performance
RootMetrics have put together a general report of all their mobile network testing for the past few months and revealed their pick of the top 16 cities (Larger Urban Zones) in the UK for mobile network performance, which saw Manchester top the table and Hull hit bottom. But caveats remain.
The rankings are based on the outcome from nearly 400,000 test samples and more than 12,000 miles driven across the UK in the second half of 2015, which examined the performance of calls, texts and data across all of the major mobile networks (O2, Vodafone, Three UK and EE (BT)). The results are then equated to an average score, with a rating of 100 being perfection.
However it’s worth pointing out that they don’t separate out the performance of different network platforms (2G, 3G or 4G), which would have been useful when judging Mobile Broadband speed. Similarly it’s important to note that some networks are more generous with data usage than others (e.g. Three UK’s “all-you-can-eat” plan) and have more spectrum available (e.g. EE and Vodafone), both of which can affect performance.
But let’s start with the general (overall) ranking before drilling down into the details.
| Rank | City | Weighted average scores |
| 1 | Manchester | 95.4 |
| 2 | Birmingham | 94.6 |
| 3 | Liverpool | 94.5 |
| 4 | Coventry | 94.3 |
| 5 | Belfast | 93.5 |
| 6 | Sheffield | 93.0 |
| 7 | Nottingham | 92.6 |
| 8 | Leicester | 92.2 |
| 9 | Edinburgh | 91.9 |
| 10 | Leeds & Bradford | 91.8 |
| 11 | Glasgow | 90.7 |
| 12 | Newcastle | 90.6 |
| 13 | London | 90.1 |
| 14 | Bristol | 87.1 |
| 15 | Cardiff | 79.2 |
| 16 | Hull | 77.9 |
You can view the full report online, but we’re also going to take a closer look at the top and bottom cities. Being ISPreview.co.uk we’re most interested in the Mobile Broadband speeds and so that will be our focus.
Overall Manchester, the UK’s second-largest metro area, finished the year at #1 in overall performance, network reliability and also mobile Internet performance. Meanwhile the “lowest” category in which Manchester ranked was #4 in call performance. Now let’s take a look at those mobile Internet speeds.
Manchester’s Mobile Internet Performance
Median Download Speed (Upload Speed)
1. EE 22.2Mbps (12Mbps)
2. Vodafone 13.6Mbps (13.5Mbps)
3. O2 10.1Mbps (9.7Mbps)
4. Three UK 10Mbps (6Mbps)
Unsurprisingly the maturity and coverage of EE’s 4G network, which had a head start on its rivals, is still paying dividends here but it’s also notable that Vodafone has a modest lead in upload speed. Now contrast the results from a top city with the results from Hull, which sits at the bottom of RootMetrics table.
RootMetrics Statement
If you read our previous UK report, you’d have noticed Bristol, Cardiff, and Hull at the bottom of our overall performance rankings. That’s exactly how the year ended as well – Bristol at #14, Cardiff at #15, and Hull at #16. No matter the operator of your choosing, mobile tasks of almost any kind are often more challenging in these locales than in the other metro areas we test.
Cardiff and Hull were the bottom two in every category, while Bristol finished at #14 in everything except call performance – in which it finished at #13. The only one of the three to break the top 10 in any area was Bristol in the first half of 2015, when it managed to place #10 in call performance.
Hull’s Mobile Internet Performance
Median Download Speed (Upload Speed)
1. Vodafone 11.4Mbps (10.1Mbps)
2. O2 9.7Mbps (7.3Mbps)
3. EE 4.7Mbps (2.1Mbps)
4. Three UK 2.1Mbps (1.9Mbps)
Quite the contrast and even more so when you compare today’s results with the picture from 2013 (here), which saw EE top the table with downloads of 9.6Mbps (5.5Mbps uploads) and Vodafone come bottom with downloads of just 1Mbps (0.5Mbps uploads).
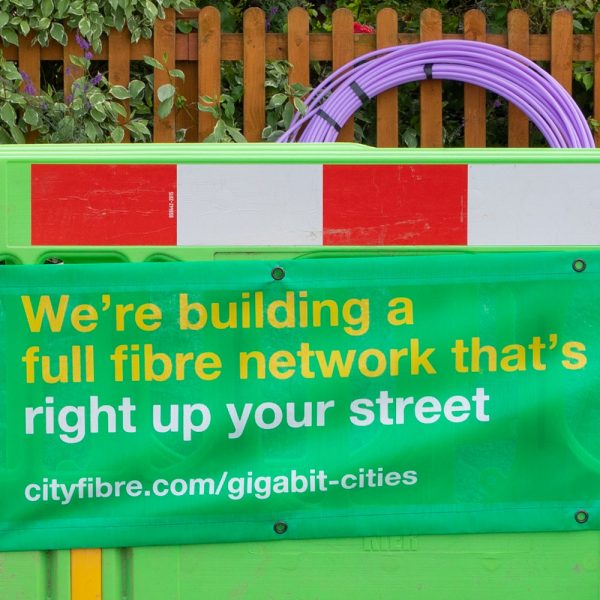
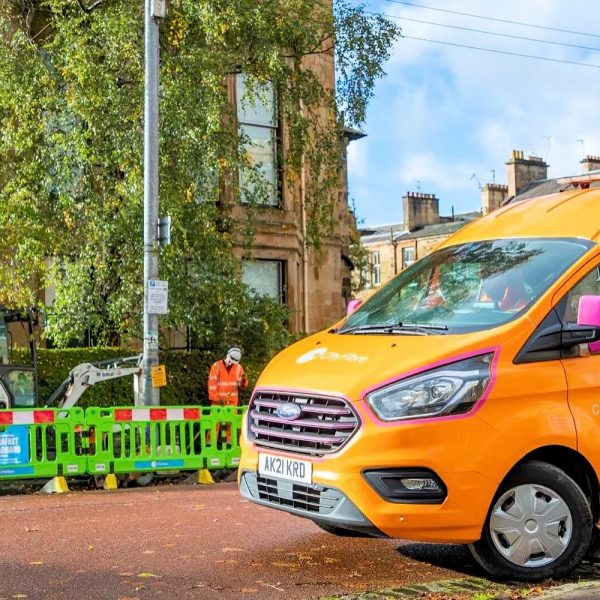
Today the situation in Hull has largely reversed and it’s not entirely clear why, although we do know that Three UK and EE have suffered from a deficiency of capacity in Hull and that’s why they’re jointly building a new fibre optic network with Cityfibre in the city (here). Never the less we would have expected to see some improvement by now.
We would give a speed summary of the other cities too, but most of the data is a replication of last year’s similar report (here). In fact in practical terms the only new data seems to come from Newcastle, Glasgow and Cardiff as they’re all using early results from 2016.
Mark is a professional technology writer, IT consultant and computer engineer from Dorset (England), he also founded ISPreview in 1999 and enjoys analysing the latest telecoms and broadband developments. Find me on X (Twitter), Mastodon, Facebook and Linkedin.


« Opposition Grows as UK ISP Internet Spying Bill Hits Parliament
Latest UK ISP News


- FTTP (5530)
- BT (3518)
- Politics (2542)
- Openreach (2298)
- Business (2266)
- Building Digital UK (2247)
- FTTC (2045)
- Mobile Broadband (1977)
- Statistics (1790)
- 4G (1668)
- Virgin Media (1621)
- Ofcom Regulation (1465)
- Fibre Optic (1396)
- Wireless Internet (1391)
- FTTH (1382)


Comments are closed