The UK 2016 vs 2015 Top Fastest Mobile and Home Broadband ISPs
It’s interesting to note that Sky remain at the bottom for download performance, which is despite continuing to receive some of the fewest consumer complaints among the big boys. Sadly Sky are tight lipped about their FTTC “fibre broadband” subscriber totals, so it’s just possible that their older and slower ADSL2+ lines might have more influence than at rival ISPs.
On the other hand the average FTTC speed for Sky was recorded as 26.2Mbps, which is well below many of the other top 10 providers. So part of the reason for their poor performance above could be because most of their subscribers are still using the old and slow SR101/102 router, which has terrible WiFi performance.
The Fastest Alternative Network ISPs
At this point we’ll turn our attention to alternative network (altnet) providers, most of which only have a comparatively small level of network coverage or sample data from customers. Unfortunately this means that we can’t offer a very comprehensive list of such ISPs, but we are able to list some of those that show up most frequently in the data.
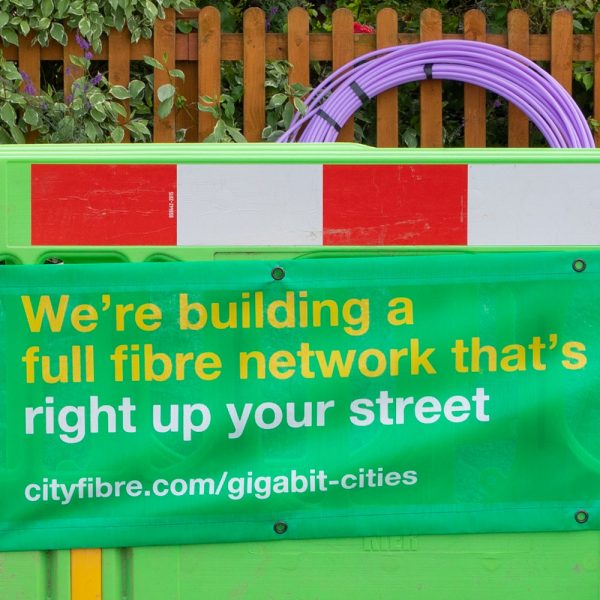
Altnets often deliver some of the fastest home broadband speeds in the country and that’s thanks in no small part to their ultrafast pure fibre optic (FTTP) infrastructure, although some (e.g. Relish) prefer to use high frequency wireless connections and elsewhere KCOM (Hull) is a mix of ADSL2+, FTTP and just a little FTTC.
Many more altnets exist than those listed below, but the sample sizes are so small as to be potentially unreliable and hence we don’t have enough data to show them. The use of WiFi can also have a particularly strong negative impact on ultrafast FTTP/H providers, which may act to mask their true capabilities.
Average Download Speeds
| No. | Operator | 2016 (Top 10%) | 2015 (Top 10%) | Change |
| 1. | Hyperoptic | 78.9Mbps (171Mbps) | 88.2Mbps (252Mbps) | –10.54% |
| 2. | Gigaclear | 64.4Mbps (104.8Mbps) | 72Mbps (154Mbps) | –10.56% |
| 3. | KCOM | 32.1Mbps (80.1Mbps) | no data | no data |
| 4. | Relish Wireless | 14.9Mbps (39.1Mbps) | 14.7Mbps (33.9Mbps) | +1.36% |
Average Upload Speeds
| No. | Operator | 2016 |
2015 | Change |
| 1. | Hyperoptic | 66.4Mbps | 77.1Mbps | –13.88% |
| 2. | Gigaclear | 62.5Mbps | 78.6Mbps | –20.48% |
| 3. | KCOM | 8.6Mbps | no data | no data |
| 4. | Relish Wireless | 1.7Mbps | 2Mbps | –15% |
Both Hyperoptic and Gigaclear operate ultra-fast Gigabit capable FTTP/B style networks and so unsurprisingly they deliver some of the fasted fixed line broadband speeds in the country, which is only being held back by the fact that each also offers a selection of slower packages at more affordable prices (i.e. most people tend to prefer 50-100Mbps to a more expensive 1Gbps service).
We wouldn’t read too much into the performance drop at the two pure fibre optic providers above because they’re still building out their networks and this may just be due to which packages end-users are opting to take, although it is something we’ll keep an eye on. Sadly neither ISP releases detailed subscriber data like the big providers, so we can’t easily judge.
The Top Fastest Mobile Network Operators
Unsurprisingly the ever increasing coverage of 4G based Mobile Broadband networks among the four primary operators has helped to support an increase in Internet connectivity performance. As per our introduction, EE (BT) delivers the best 4G coverage and has one of strongest deployments of faster LTE-Advanced technology, which helps to fuel a clear lead.
However it should be said that their rivals are catching up and by this time next year some of the results could be a lot closer, although EE’s win of the Government’s new Emergency Services Network contract means that their coverage is still likely to be superior (i.e. EE’s 4G geographic reach should hit 95% of the by 2020, which equates to 99.8% of the UK population).
Average Download Speeds
| No. | Operator | 2016 |
2015 |
Change |
| 1. | EE | 27.4Mbps | 18.3Mbps | +49.73% |
| 2. | Vodafone | 16.3Mbps | 14.3Mbps | +13.99% |
| 3. | Three UK | 14.4Mbps | 11.4Mbps | +26.32% |
| 4. | O2 | 14.4Mbps | 12Mbps | +20% |
Average Upload Speeds
| No. | Operator | 2016 |
2015 |
Change |
| 1. | EE | 5.3Mbps | 4.2Mbps | +26.19% |
| 2. | Three UK | 3.7Mbps | 3.1Mbps | +19.35% |
| 3. | Vodafone | 3.5Mbps | 3.1Mbps | +12.9% |
| 4. | O2 | 3.1Mbps | 2.6Mbps | +19.23% |
Disclaimer: It’s important to take average speeds, like those reported above, with a big pinch of salt. Every home is different and performance can be affected by all sorts of issues, many of which are beyond the provider’s ability to control (e.g. slow wi-fi or poor home wiring), thus we do not consider the above data to be a reliable barometer for individual users, but it can help to highlight general changes in the market.
Mobile connections are also particularly subject to the daily movements and radically differing hardware choices (Smartphones etc.) of their end-users, which makes it especially difficult to establish a reliable picture of performance across each network.
Finally, readers can conduct a test of their Internet connection performance via our Speedtest Page, which also contains a simplified summary of the above data including the previous mid-year 2016 result instead of the 2015 score; this reflects the fact that we tend to update our service speed data every 6 months.
Mark is a professional technology writer, IT consultant and computer engineer from Dorset (England), he also founded ISPreview in 1999 and enjoys analysing the latest telecoms and broadband developments. Find me on X (Twitter), Mastodon, Facebook and Linkedin.


« Christmas Day Pushes Sky Broadband UK ISP Network Traffic to 5Tbps
Latest UK ISP News


- FTTP (5515)
- BT (3514)
- Politics (2537)
- Openreach (2297)
- Business (2262)
- Building Digital UK (2244)
- FTTC (2043)
- Mobile Broadband (1973)
- Statistics (1788)
- 4G (1664)
- Virgin Media (1619)
- Ofcom Regulation (1461)
- Fibre Optic (1395)
- Wireless Internet (1389)
- FTTH (1381)


Comments are closed