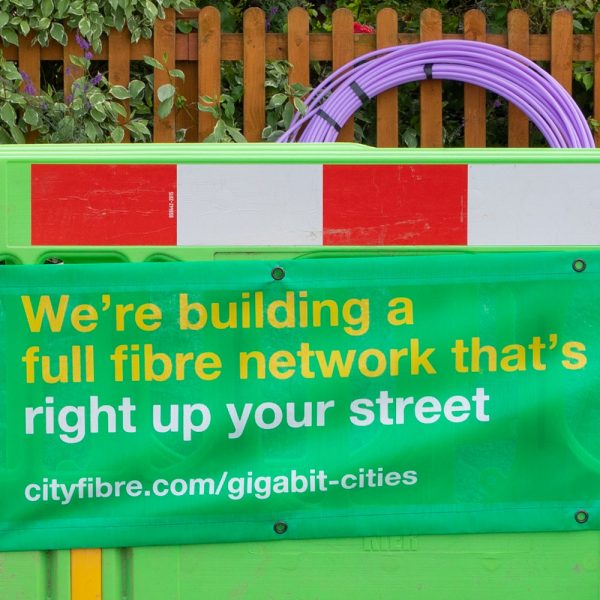
The Top 390 Fastest and Slowest UK Local Authority Areas by Broadband Speed
Consumer magazine Which? has today published the results of a new survey that reveals the fastest and slowest local authorities across the United Kingdom by broadband download speed (median). The Orkney Islands (6.3Mbps) are by far the slowest and Tamworth is the fastest (30.4Mbps).
The study is based on data from 719,000 consumer speedtests that were conducted between January to March 2017 by Speed Checker Limited, which doesn’t just reflect fixed line home broadband connections but also appears to include speedtests from Mobile Broadband operators and Enterprise (business) lines. However the results should be taken with a pinch of salt and we’ll explain why a little later on.
The top three fastest areas for average (median) download speed were Tamworth (30.4Mbps), Reading (30Mbps) and Adur (29.2) in England. By comparison the slowest three areas were all in Scotland and include the Orkney Islands (6.3Mbps), Shetland Islands (8.4Mbps) and the Highlands (8.8Mbps).
Alex Neill, Which? Managing Director of Home Services, said:
“Far too many households across the UK are suffering from slow broadband speeds, which can stop you being able to carry out essential daily tasks.
We are encouraging everyone with broadband to use our speed checker so people can see if they are getting the speeds that they’ve been promised by their provider and find out how to complain if their speed is too slow.
This will also help to further highlight where problem areas are across the UK, putting pressure on Government and providers to help everyone get a good broadband connection.”
Overall it’s noted that around 11 local authority areas failed to achieve an average download speed of faster than 10 Megabits per second, which is of course the proposed level that the Government has provisionally set for their forthcoming Universal Service Obligation (USO). We are expecting a final consultation on the proposed USO design to be published this summer.
However nobody seems to mention the fact that a huge number of areas are also failing to achieve the Government’s original definition of “superfast broadband” (24Mbps+) and many also fall below the latest definition (30Mbps+), which tends to apply in newer contracts (except in certain parts of the UK, such as Wales, where 30Mbps+ has been adopted since the first contracts were signed).
Cllr Mark Hawthorne, Chairman of the Local Government Association, added:
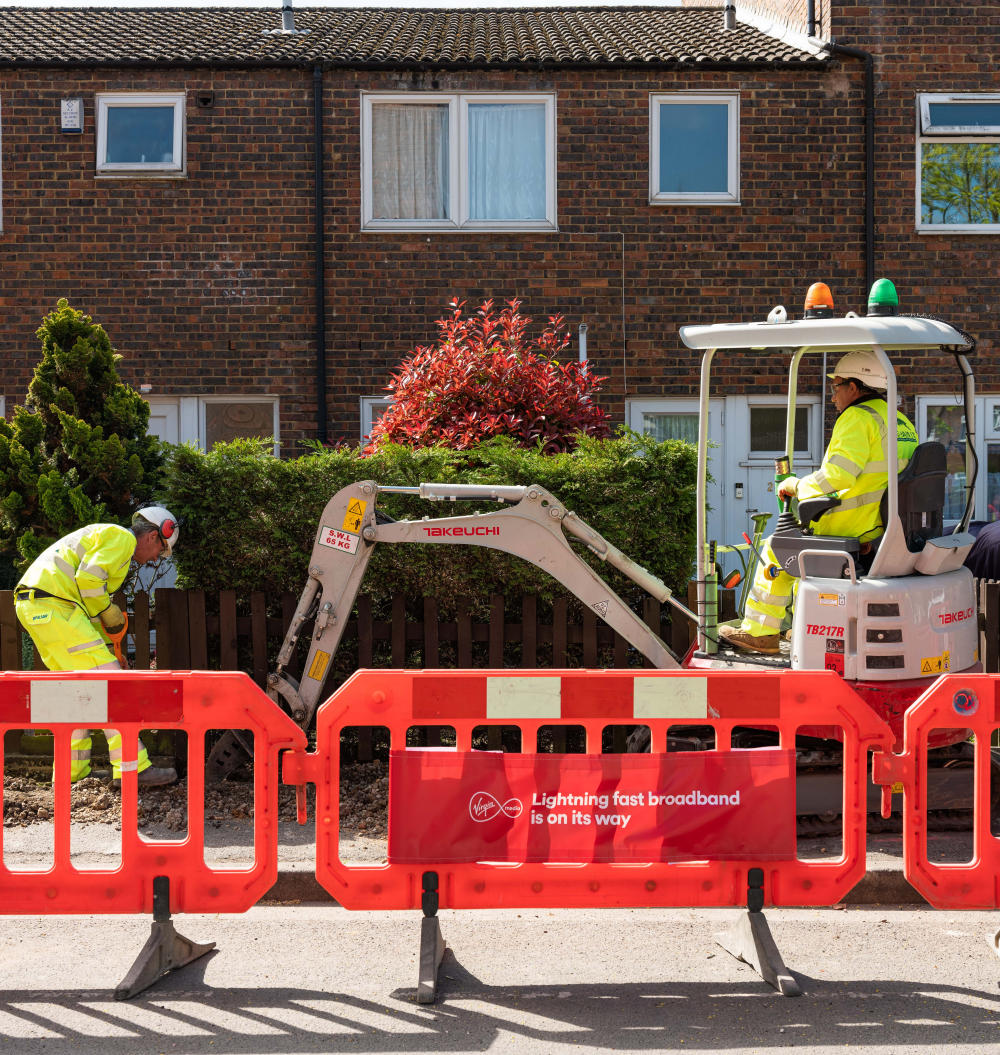
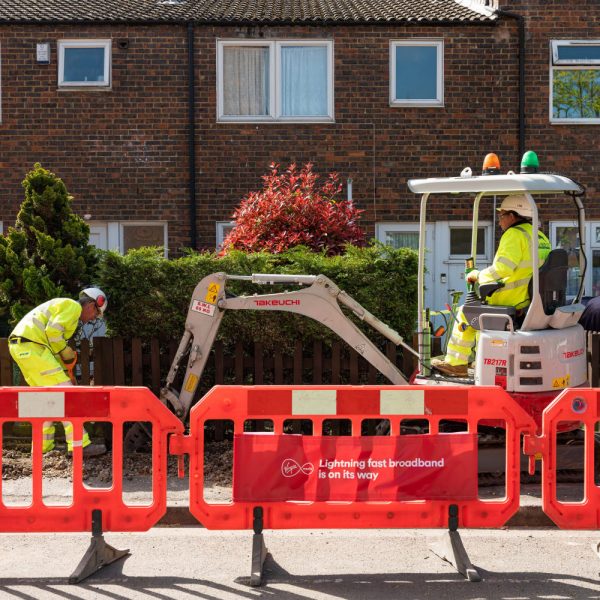
“Councils have played an important role in the extension of digital connectivity to millions of households through the Superfast Broadband Programme. Around £740 million of the £1.7 billion invested in this has come from local government. Many councils are aiming to beat the Government’s national target of 95 per cent coverage of premises by December 2017.
At present, in many areas less than 40 per cent of households have chosen to take up superfast speeds where they have been made available as part of the Programme and councils would encourage residents in non-metropolitan areas to double check to see whether they have access to more reliable broadband.
For those who will not be connected by the Programme and cannot reach download speeds of 10Mbps, the Government will implement a broadband universal service obligation (USO) to give them the legal right to request a better connection that guarantees 10Mbps download speed by 2020.
The LGA has called for the Government to also guarantee a minimum upload speed, and include a social tariff to ensure a decent broadband connection is available at an affordable price, to those that would not be able to afford one.”
As usual there are some significant caveats with studies like this, which aren’t even mentioned in the various press releases from the LGA or Which?, and they deserve some attention in order to give the correct context. One of the biggest and most obvious caveats centres on the issue of network availability vs take-up.
At present the Government’s £1.7bn (public funding commitment) Broadband Delivery UK project is working to extend “superfast broadband” (24Mbps+) networks to cover 95% of UK premises by the end of 2017 and this could reach around 97% by the end of 2020. The current estimated level of national coverage is said to be nearing 93%, although this will be higher and lower in different areas (e.g. Orkney and Shetland sit at around 62%).
Clearly a lot of areas have a high availability of so-called “superfast broadband” and so you’d expect their overall results to be better, although crucially not everybody chooses to upgrade. Indeed it usually takes several years of natural migration before the majority in any given area have adopted the new services (e.g. national take-up in BDUK upgraded areas is currently about 39% and the main roll-out began in late 2013).
In other words, many consumers remain on slower connections (e.g. ADSL lines) and this tends to continue until they see a need or reason to upgrade (i.e. they’re happy with the existing service). Other factors can also impact take-up, such as the higher prices for “superfast” connections (less attractive for consumers), being locked into a long contract with your existing ISP (can’t upgrade immediately), a lack of general availability awareness (people sometimes don’t know a faster service exists) and local problems with network capacity.
Suffice to say that around half of the UK still take these slower connections and other factors, such as slow WiFi, can also impact the results. In short, studies like this don’t accurately reflect the availability of faster networks. However Ofcom’s recent proposal to slash the wholesale cost of Openreach’s (BT) 40Mbps download (10Mbps upload) FTTC tier (here), which covers most of the UK, could help to encourage more rapid adoption.
We’ve published the full results below and ordered the table by median (average) speed, starting from the slowest and going to the fastest. We’ve also included the mean average for additional context. For those who don’t know, the mean is the sum of all the numbers in the set divided by the amount of numbers in the set, while the median is the middle point of a number set, in which half the numbers are above the median and half are below.
| Authority Name | Region | Median DL (Mbps) | Mean DL (Mbps) | Tests Count |
| Orkney Islands | Scotland | 6.3 | 11.9 | 299 |
| Shetland Islands | Scotland | 8.4 | 14.4 | 449 |
| Highland | Scotland | 8.8 | 14.5 | 4,673 |
| Ryedale | Yorkshire and The Humber | 9 | 17.9 | 940 |
| Purbeck | South West | 9 | 15.5 | 900 |
| Na h-Eileanan Siar | Scotland | 9.1 | 17.8 | 424 |
| Powys | Wales | 9.4 | 18.5 | 1,881 |
| West Devon | South West | 9.5 | 16 | 1,185 |
| Eden | North West | 9.5 | 14.6 | 1,118 |
| Rother | South East | 9.5 | 17.2 | 1,431 |
| Stirling | Scotland | 9.8 | 15.9 | 1,435 |
| Monmouthshire | Wales | 10 | 16.9 | 1,437 |
| Isle of Anglesey | Wales | 10.1 | 16.9 | 883 |
| Southwark | London | 10.4 | 21.4 | 3,297 |
| Suffolk Coastal | East | 10.5 | 18.4 | 1,986 |
| Allerdale | North West | 10.7 | 18.5 | 1,512 |
| Breckland | East | 10.8 | 16.7 | 2,204 |
| Maldon | East | 10.8 | 17 | 1,272 |
| West Somerset | South West | 10.9 | 17.8 | 573 |
| Kingston upon Hull, City of | Yorkshire and The Humber | 10.9 | 32.9 | 1,642 |
| Mid Ulster | Northern Ireland | 11.1 | 18.3 | 1,254 |
| South Lakeland | North West | 11.5 | 17.8 | 1,736 |
| South Holland | East Midlands | 11.5 | 17.2 | 1,412 |
| Mid Devon | South West | 11.5 | 16 | 1,433 |
| Aberdeenshire | Scotland | 11.5 | 17.1 | 4,042 |
| Mid Suffolk | East | 11.8 | 17.7 | 1,885 |
| Braintree | East | 11.9 | 17.9 | 2,151 |
| Scottish Borders | Scotland | 12 | 17.4 | 1,385 |
| East Staffordshire | West Midlands | 12 | 17.8 | 2,005 |
| Argyll and Bute | Scotland | 12.2 | 18.8 | 1,836 |
| Newry, Mourne and Down | Northern Ireland | 12.2 | 17.8 | 1,317 |
| Mendip | South West | 12.3 | 19.3 | 1,701 |
| Torfaen | Wales | 12.3 | 20.3 | 1,213 |
| South Norfolk | East | 12.3 | 18.2 | 2,276 |
| Dumfries and Galloway | Scotland | 12.4 | 17.6 | 2,052 |
| North Norfolk | East | 12.5 | 16.6 | 1,714 |
| Moray | Scotland | 12.5 | 18.8 | 1,532 |
| Carmarthenshire | Wales | 12.5 | 17.5 | 2,721 |
| New Forest | South East | 12.6 | 18.8 | 2,559 |
| Westminster | London | 12.9 | 21.1 | 1,651 |
| South Ayrshire | Scotland | 12.9 | 21.5 | 1,969 |
| Causeway Coast and Glens | Northern Ireland | 12.9 | 18.2 | 1,440 |
| Richmondshire | Yorkshire and The Humber | 13 | 18.5 | 567 |
| Sevenoaks | South East | 13 | 20.6 | 1,389 |
| Canterbury | South East | 13.1 | 19.1 | 2,342 |
| Perth and Kinross | Scotland | 13.1 | 19.8 | 2,462 |
| Midlothian | Scotland | 13.1 | 18.8 | 1,718 |
| Lambeth | London | 13.2 | 22 | 3,067 |
| West Lancashire | North West | 13.2 | 18.5 | 1,574 |
| Pembrokeshire | Wales | 13.3 | 20.2 | 1,793 |
| Tendring | East | 13.3 | 17.8 | 2,033 |
| Uttlesford | East | 13.3 | 18.7 | 1,142 |
| Malvern Hills | West Midlands | 13.3 | 19.5 | 1,207 |
| Torridge | South West | 13.4 | 19.8 | 816 |
| City of London | London | 13.4 | 22.4 | 247 |
| Forest of Dean | South West | 13.5 | 22.1 | 1,439 |
| Stroud | South West | 13.5 | 18.9 | 1,877 |
| Pendle | North West | 13.6 | 20.2 | 923 |
| Castle Point | East | 13.7 | 20.6 | 1,410 |
| Fermanagh and Omagh | Northern Ireland | 13.7 | 17.8 | 783 |
| East Lindsey | East Midlands | 13.7 | 18.9 | 2,110 |
| Staffordshire Moorlands | West Midlands | 13.8 | 22.3 | 1,469 |
| Melton | East Midlands | 13.8 | 22.4 | 749 |
| Shropshire | West Midlands | 13.8 | 19.7 | 4,722 |
| Mid and East Antrim | Northern Ireland | 13.8 | 20.1 | 1,509 |
| Chelmsford | East | 13.8 | 22.2 | 2,247 |
| Derbyshire Dales | East Midlands | 13.8 | 18.3 | 1,039 |
| Selby | Yorkshire and The Humber | 13.9 | 19.2 | 1,544 |
| Tewkesbury | South West | 13.9 | 21.7 | 1,370 |
| Thanet | South East | 13.9 | 19.1 | 1,535 |
| South Hams | South West | 14 | 19.9 | 1,413 |
| Denbighshire | Wales | 14 | 18.9 | 942 |
| Tunbridge Wells | South East | 14 | 20 | 1,333 |
| Craven | Yorkshire and The Humber | 14 | 20.7 | 834 |
| Cornwall | South West | 14.1 | 24 | 6,697 |
| Armagh City, Banbridge and Craigavon | Northern Ireland | 14.1 | 19.3 | 1,948 |
| East Lothian | Scotland | 14.1 | 20.5 | 1,286 |
| North Dorset | South West | 14.1 | 19.2 | 1,117 |
| Caerphilly | Wales | 14.2 | 20.5 | 2,425 |
| Herefordshire, County of | West Midlands | 14.2 | 23.2 | 2,775 |
| King’s Lynn and West Norfolk | East | 14.2 | 19.1 | 2,297 |
| Eastbourne | South East | 14.2 | 19.8 | 1,095 |
| Rotherham | Yorkshire and The Humber | 14.3 | 21.5 | 3,677 |
| Dudley | West Midlands | 14.4 | 26 | 3,637 |
| Cheshire West and Chester | North West | 14.4 | 21.5 | 5,661 |
| Aberdeen City | Scotland | 14.4 | 19.6 | 2,402 |
| Rossendale | North West | 14.5 | 20.7 | 960 |
| Rochford | East | 14.5 | 20.2 | 1,060 |
| Angus | Scotland | 14.5 | 21 | 1,515 |
| Cheshire East | North West | 14.5 | 22.3 | 5,224 |
| Horsham | South East | 14.5 | 21.7 | 1,709 |
| Stratford-on-Avon | West Midlands | 14.5 | 22.5 | 1,825 |
| Lewes | South East | 14.5 | 19.9 | 1,068 |
| St Edmundsbury | East | 14.6 | 20.3 | 1,462 |
| Bromsgrove | West Midlands | 14.7 | 20.9 | 1,339 |
| Amber Valley | East Midlands | 14.7 | 19.5 | 1,714 |
| North Hertfordshire | East | 14.7 | 23.5 | 1,562 |
| Lichfield | West Midlands | 14.8 | 24.4 | 1,223 |
| Ceredigion | Wales | 14.8 | 19.1 | 1,247 |
| High Peak | East Midlands | 15 | 19.8 | 1,170 |
| Calderdale | Yorkshire and The Humber | 15 | 23.2 | 2,542 |
| Winchester | South East | 15 | 25.2 | 1,616 |
| Fenland | East | 15 | 24.7 | 1,221 |
| Bridgend | Wales | 15 | 21.5 | 1,745 |
| Tower Hamlets | London | 15 | 29 | 2,013 |
| Scarborough | Yorkshire and The Humber | 15 | 19.7 | 1,156 |
| Mid Sussex | South East | 15.1 | 21 | 1,730 |
| North Devon | South West | 15.1 | 20.4 | 1,045 |
| Ashfield | East Midlands | 15.1 | 25.4 | 1,739 |
| Sedgemoor | South West | 15.2 | 20.9 | 2,174 |
| Wealden | South East | 15.2 | 20.3 | 1,673 |
| East Riding of Yorkshire | Yorkshire and The Humber | 15.2 | 24.4 | 4,144 |
| Daventry | East Midlands | 15.3 | 22.1 | 1,673 |
| North Warwickshire | West Midlands | 15.3 | 23.5 | 808 |
| North East Derbyshire | East Midlands | 15.3 | 19.6 | 1,520 |
| Tonbridge and Malling | South East | 15.3 | 23 | 1,448 |
| Wakefield | Yorkshire and The Humber | 15.4 | 21.7 | 4,221 |
| Barnsley | Yorkshire and The Humber | 15.4 | 20.4 | 3,795 |
| Dover | South East | 15.5 | 22.4 | 1,203 |
| Conwy | Wales | 15.5 | 22 | 1,427 |
| North Ayrshire | Scotland | 15.5 | 22.7 | 2,011 |
| Hillingdon | London | 15.5 | 29.5 | 2,256 |
| South Somerset | South West | 15.6 | 20.2 | 3,155 |
| Hastings | South East | 15.6 | 20.9 | 1,077 |
| Wirral | North West | 15.6 | 22.6 | 3,777 |
| Dacorum | East | 15.7 | 22.6 | 1,583 |
| Carlisle | North West | 15.7 | 24.1 | 1,679 |
| Inverclyde | Scotland | 15.8 | 27 | 721 |
| Gateshead | North East | 15.8 | 25.7 | 1,756 |
| Renfrewshire | Scotland | 15.8 | 27.1 | 1,777 |
| Mole Valley | South East | 15.8 | 27 | 785 |
| East Hertfordshire | East | 15.8 | 29.3 | 1,322 |
| Wycombe | South East | 15.8 | 21.8 | 2,593 |
| Chichester | South East | 15.9 | 21 | 1,255 |
| Flintshire | Wales | 15.9 | 19.7 | 2,289 |
| Swale | South East | 15.9 | 22.4 | 1,567 |
| Babergh | East | 16 | 21.1 | 1,491 |
| Cotswold | South West | 16 | 21 | 1,381 |
| East Devon | South West | 16 | 21 | 2,464 |
| Christchurch | South West | 16 | 26.4 | 609 |
| Hackney | London | 16 | 28.4 | 1,368 |
| West Berkshire | South East | 16 | 25 | 1,947 |
| Taunton Deane | South West | 16 | 20.5 | 1,361 |
| Vale of Glamorgan | Wales | 16.1 | 24.1 | 1,344 |
| Colchester | East | 16.1 | 25.1 | 2,077 |
| Torbay | South West | 16.2 | 25 | 1,527 |
| Coventry | West Midlands | 16.2 | 26.3 | 3,004 |
| Worcester | West Midlands | 16.2 | 20.5 | 1,073 |
| Broadland | East | 16.2 | 23.2 | 2,270 |
| Barrow-in-Furness | North West | 16.2 | 20.7 | 940 |
| East Dorset | South West | 16.2 | 21.4 | 1,356 |
| Walsall | West Midlands | 16.2 | 24.9 | 2,545 |
| Boston | East Midlands | 16.3 | 19.7 | 772 |
| Forest Heath | East | 16.3 | 23.9 | 679 |
| Wrexham | Wales | 16.4 | 21.4 | 2,252 |
| Hambleton | Yorkshire and The Humber | 16.4 | 21 | 1,464 |
| West Dorset | South West | 16.4 | 22.5 | 1,951 |
| Lewisham | London | 16.5 | 28.5 | 1,700 |
| Wychavon | West Midlands | 16.5 | 21.9 | 2,338 |
| Croydon | London | 16.6 | 28.9 | 2,234 |
| Doncaster | Yorkshire and The Humber | 16.6 | 23.8 | 3,258 |
| Clackmannanshire | Scotland | 16.7 | 22.7 | 818 |
| North Kesteven | East Midlands | 16.7 | 24.1 | 1,489 |
| Basingstoke and Deane | South East | 16.7 | 24.6 | 2,192 |
| Kirklees | Yorkshire and The Humber | 16.8 | 26.9 | 3,973 |
| Southampton | South East | 16.8 | 28.4 | 2,434 |
| Maidstone | South East | 16.8 | 24.3 | 1,987 |
| Sheffield | Yorkshire and The Humber | 16.8 | 23.2 | 5,708 |
| St Albans | East | 16.8 | 25.2 | 1,458 |
| Lisburn and Castlereagh | Northern Ireland | 16.8 | 24.5 | 1,478 |
| North Somerset | South West | 16.8 | 21.3 | 3,484 |
| Thurrock | East | 16.9 | 26.8 | 1,283 |
| Lancaster | North West | 16.9 | 23.3 | 1,728 |
| Teignbridge | South West | 16.9 | 23.6 | 1,899 |
| West Lothian | Scotland | 16.9 | 24.9 | 2,447 |
| South Cambridgeshire | East | 16.9 | 25.4 | 1,915 |
| Test Valley | South East | 16.9 | 26.5 | 1,363 |
| Isle of Wight | South East | 16.9 | 22.6 | 1,772 |
| Exeter | South West | 16.9 | 28.9 | 1,265 |
| Wandsworth | London | 17 | 26.7 | 2,140 |
| Havant | South East | 17 | 30.7 | 1,343 |
| Surrey Heath | South East | 17 | 27.1 | 1,003 |
| Aylesbury Vale | South East | 17 | 24.2 | 2,858 |
| Northumberland | North East | 17 | 21.3 | 4,293 |
| Stoke-on-Trent | West Midlands | 17 | 26 | 3,198 |
| Tandridge | South East | 17 | 24.4 | 1,022 |
| Wyre | North West | 17 | 20.7 | 1,327 |
| Bury | North West | 17 | 25.7 | 1,923 |
| Newark and Sherwood | East Midlands | 17.1 | 24 | 1,811 |
| Copeland | North West | 17.1 | 21.5 | 1,216 |
| Glasgow City | Scotland | 17.1 | 24.1 | 5,735 |
| Ards and North Down | Northern Ireland | 17.1 | 23.2 | 1,705 |
| Brentwood | East | 17.2 | 21.5 | 913 |
| Wiltshire | South West | 17.2 | 23.6 | 7,765 |
| Newcastle-under-Lyme | West Midlands | 17.2 | 24.4 | 1,858 |
| Salford | North West | 17.2 | 29.9 | 2,110 |
| Hammersmith and Fulham | London | 17.3 | 25.7 | 1,135 |
| Leeds | Yorkshire and The Humber | 17.3 | 27.2 | 7,591 |
| Ribble Valley | North West | 17.4 | 22 | 648 |
| Reigate and Banstead | South East | 17.4 | 26.7 | 1,318 |
| Chesterfield | East Midlands | 17.4 | 23.2 | 1,213 |
| Fareham | South East | 17.4 | 26.7 | 1,767 |
| Bath and North East Somerset | South West | 17.5 | 24.5 | 2,268 |
| Windsor and Maidenhead | South East | 17.5 | 27.6 | 1,589 |
| South Staffordshire | West Midlands | 17.6 | 21.9 | 1,394 |
| Weymouth and Portland | South West | 17.7 | 21.9 | 1,191 |
| North Lincolnshire | Yorkshire and The Humber | 17.7 | 26.7 | 2,330 |
| Waverley | South East | 17.8 | 23.5 | 1,344 |
| Shepway | South East | 17.8 | 22.1 | 1,268 |
| Ashford | South East | 17.9 | 24.5 | 1,568 |
| Cannock Chase | West Midlands | 17.9 | 24.4 | 1,129 |
| Wyre Forest | West Midlands | 17.9 | 24.5 | 1,259 |
| Wellingborough | East Midlands | 17.9 | 27.6 | 1,083 |
| Ipswich | East | 17.9 | 29.8 | 1,405 |
| Fife | Scotland | 17.9 | 24.4 | 4,943 |
| Central Bedfordshire | East | 18 | 26.3 | 3,217 |
| Swindon | South West | 18 | 31.6 | 2,325 |
| Swansea | Wales | 18 | 28.9 | 2,436 |
| Fylde | North West | 18.1 | 22.4 | 1,189 |
| West Lindsey | East Midlands | 18.1 | 22.6 | 1,212 |
| York | Yorkshire and The Humber | 18.1 | 30.5 | 2,257 |
| South Bucks | South East | 18.1 | 29.6 | 745 |
| Harrogate | Yorkshire and The Humber | 18.2 | 27.5 | 1,662 |
| Tameside | North West | 18.2 | 22.9 | 2,557 |
| Rochdale | North West | 18.2 | 24.1 | 2,066 |
| East Dunbartonshire | Scotland | 18.3 | 26.3 | 1,554 |
| Camden | London | 18.3 | 31.7 | 1,480 |
| Gwynedd | Wales | 18.3 | 22.7 | 1,492 |
| Huntingdonshire | East | 18.3 | 26.5 | 2,216 |
| Bassetlaw | East Midlands | 18.3 | 21.8 | 2,010 |
| County Durham | North East | 18.4 | 21.5 | 6,114 |
| East Northamptonshire | East Midlands | 18.5 | 30 | 1,087 |
| East Cambridgeshire | East | 18.5 | 24.1 | 928 |
| Haringey | London | 18.5 | 33.3 | 1,239 |
| Barnet | London | 18.6 | 25.8 | 2,684 |
| Newcastle upon Tyne | North East | 18.6 | 25.9 | 2,373 |
| Rushcliffe | East Midlands | 18.6 | 29.1 | 1,191 |
| Newport | Wales | 18.6 | 23.9 | 1,746 |
| Richmond upon Thames | London | 18.8 | 32.3 | 1,444 |
| South Kesteven | East Midlands | 18.8 | 23.2 | 2,259 |
| Blackburn with Darwen | North West | 18.8 | 26.3 | 1,363 |
| Hyndburn | North West | 18.8 | 27.1 | 763 |
| South Tyneside | North East | 18.9 | 24.6 | 1,374 |
| Gosport | South East | 18.9 | 25.4 | 1,435 |
| South Lanarkshire | Scotland | 18.9 | 26.4 | 3,950 |
| Chorley | North West | 18.9 | 26.1 | 1,565 |
| Antrim and Newtownabbey | Northern Ireland | 18.9 | 22.9 | 1,589 |
| Telford and Wrekin | West Midlands | 19 | 26.4 | 2,169 |
| Norwich | East | 19 | 27 | 1,654 |
| Mansfield | East Midlands | 19.1 | 26.1 | 1,615 |
| Bradford | Yorkshire and The Humber | 19.1 | 27.6 | 4,223 |
| Waveney | East | 19.2 | 22.9 | 1,452 |
| Merthyr Tydfil | Wales | 19.2 | 22.7 | 659 |
| Bexley | London | 19.2 | 32.1 | 1,820 |
| East Ayrshire | Scotland | 19.2 | 27.9 | 1,789 |
| Gravesham | South East | 19.2 | 26 | 887 |
| Rhondda Cynon Taf | Wales | 19.2 | 23 | 2,945 |
| Islington | London | 19.2 | 37.2 | 1,349 |
| Sefton | North West | 19.2 | 27.6 | 2,617 |
| Stockport | North West | 19.3 | 30.4 | 3,100 |
| Neath Port Talbot | Wales | 19.3 | 27 | 1,383 |
| City of Edinburgh | Scotland | 19.4 | 31.4 | 4,527 |
| Preston | North West | 19.4 | 28.4 | 1,316 |
| Harborough | East Midlands | 19.5 | 26 | 1,178 |
| South Ribble | North West | 19.5 | 26.3 | 1,338 |
| Derry City and Strabane | Northern Ireland | 19.5 | 25.1 | 1,474 |
| Manchester | North West | 19.6 | 28.2 | 3,156 |
| East Hampshire | South East | 19.7 | 24.4 | 1,355 |
| Arun | South East | 19.7 | 24.7 | 1,733 |
| Blackpool | North West | 19.8 | 34.8 | 1,580 |
| Burnley | North West | 19.8 | 24.7 | 1,218 |
| Charnwood | East Midlands | 19.8 | 26.7 | 1,935 |
| East Renfrewshire | Scotland | 19.8 | 30.5 | 1,141 |
| Basildon | East | 19.9 | 30.3 | 1,786 |
| Lincoln | East Midlands | 19.9 | 31.2 | 995 |
| Milton Keynes | South East | 19.9 | 24.5 | 3,485 |
| Bolsover | East Midlands | 19.9 | 24.9 | 960 |
| Great Yarmouth | East | 20 | 24.8 | 1,219 |
| Blaby | East Midlands | 20 | 31.6 | 1,235 |
| Liverpool | North West | 20 | 30.8 | 3,681 |
| South Northamptonshire | East Midlands | 20 | 24 | 1,400 |
| Birmingham | West Midlands | 20 | 30 | 6,892 |
| Falkirk | Scotland | 20 | 30.8 | 1,686 |
| Runnymede | South East | 20 | 23.8 | 786 |
| Cardiff | Wales | 20 | 27.3 | 3,357 |
| Sunderland | North East | 20.1 | 27.8 | 2,866 |
| Stafford | West Midlands | 20.1 | 29.1 | 1,987 |
| Brent | London | 20.1 | 29.4 | 1,740 |
| Poole | South West | 20.1 | 33.4 | 2,206 |
| West Oxfordshire | South East | 20.2 | 26.6 | 1,129 |
| Knowsley | North West | 20.3 | 30.2 | 1,127 |
| South Derbyshire | East Midlands | 20.3 | 23.9 | 1,594 |
| Vale of White Horse | South East | 20.4 | 28.2 | 1,408 |
| Barking and Dagenham | London | 20.4 | 29.8 | 1,095 |
| Eastleigh | South East | 20.4 | 29.9 | 1,599 |
| Warwick | West Midlands | 20.5 | 29.7 | 1,473 |
| Havering | London | 20.7 | 30.4 | 2,080 |
| West Dunbartonshire | Scotland | 20.7 | 31.1 | 836 |
| Peterborough | East | 20.7 | 28.6 | 2,099 |
| Stockton-on-Tees | North East | 20.7 | 32.3 | 2,224 |
| Rugby | West Midlands | 20.8 | 28 | 1,860 |
| Wigan | North West | 20.8 | 32.3 | 3,495 |
| Hinckley and Bosworth | East Midlands | 20.9 | 26.8 | 1,582 |
| Epping Forest | East | 21 | 32.1 | 1,137 |
| South Oxfordshire | South East | 21 | 27.6 | 1,757 |
| Newham | London | 21 | 32.9 | 1,485 |
| Sandwell | West Midlands | 21.1 | 28.8 | 2,418 |
| Redcar and Cleveland | North East | 21.1 | 31.5 | 1,401 |
| Medway | South East | 21.2 | 30.8 | 2,968 |
| Kettering | East Midlands | 21.2 | 33.1 | 954 |
| North West Leicestershire | East Midlands | 21.2 | 32.9 | 1,491 |
| Kensington and Chelsea | London | 21.3 | 31.8 | 1,100 |
| Nottingham | East Midlands | 21.3 | 34.4 | 2,287 |
| Oldham | North West | 21.3 | 27.6 | 1,891 |
| Spelthorne | South East | 21.4 | 31.7 | 819 |
| Hounslow | London | 21.4 | 33.2 | 1,654 |
| Northampton | East Midlands | 21.4 | 32.5 | 2,413 |
| Portsmouth | South East | 21.4 | 31.8 | 2,143 |
| Chiltern | South East | 21.5 | 28.6 | 899 |
| Waltham Forest | London | 21.5 | 34 | 1,266 |
| Plymouth | South West | 21.5 | 34.3 | 2,654 |
| Gloucester | South West | 21.6 | 35.9 | 1,170 |
| Bedford | East | 21.7 | 27.4 | 1,965 |
| Gedling | East Midlands | 21.7 | 31.9 | 1,245 |
| Leicester | East Midlands | 21.7 | 33.6 | 2,422 |
| Slough | South East | 21.7 | 30.1 | 1,134 |
| St. Helens | North West | 21.8 | 31.6 | 1,886 |
| North Tyneside | North East | 21.9 | 32 | 2,054 |
| Sutton | London | 21.9 | 31.3 | 1,629 |
| Bristol, City of | South West | 22 | 31.2 | 3,574 |
| Warrington | North West | 22 | 29.1 | 2,794 |
| Greenwich | London | 22 | 30.9 | 1,869 |
| Dartford | South East | 22.1 | 28 | 1,029 |
| Trafford | North West | 22.2 | 29.4 | 2,547 |
| Southend-on-Sea | East | 22.2 | 29.8 | 1,618 |
| Cambridge | East | 22.2 | 30 | 1,207 |
| Cheltenham | South West | 22.2 | 30.7 | 1,294 |
| Redditch | West Midlands | 22.3 | 28.4 | 773 |
| Oadby and Wigston | East Midlands | 22.4 | 34.7 | 429 |
| Bolton | North West | 22.4 | 32.2 | 2,578 |
| Rutland | East Midlands | 22.4 | 25.7 | 456 |
| Worthing | South East | 22.7 | 33.5 | 1,081 |
| Solihull | West Midlands | 22.8 | 30.8 | 2,385 |
| Ealing | London | 22.8 | 28.9 | 2,456 |
| Darlington | North East | 23 | 33.4 | 1,031 |
| Hertsmere | East | 23 | 32.5 | 617 |
| Wolverhampton | West Midlands | 23.1 | 34.6 | 1,877 |
| Woking | South East | 23.2 | 40 | 1,190 |
| Hart | South East | 23.3 | 31.2 | 1,116 |
| Belfast | Northern Ireland | 23.3 | 34.1 | 2,418 |
| Broxtowe | East Midlands | 23.3 | 32 | 1,242 |
| Derby | East Midlands | 23.4 | 34.4 | 2,213 |
| Oxford | South East | 23.5 | 34.2 | 879 |
| Epsom and Ewell | South East | 23.5 | 27.2 | 1,109 |
| Bournemouth | South West | 23.6 | 36.3 | 1,708 |
| Harrow | London | 23.6 | 32.4 | 1,595 |
| South Gloucestershire | South West | 23.6 | 33.2 | 2,927 |
| Wokingham | South East | 23.6 | 30.9 | 2,025 |
| Watford | East | 23.7 | 39.5 | 616 |
| Erewash | East Midlands | 23.8 | 30.3 | 1,221 |
| Bromley | London | 23.8 | 31.1 | 2,794 |
| Welwyn Hatfield | East | 23.9 | 32.8 | 995 |
| North Lanarkshire | Scotland | 23.9 | 32.7 | 3,520 |
| Cherwell | South East | 24 | 27.3 | 2,104 |
| Bracknell Forest | South East | 24 | 33.4 | 1,276 |
| Hartlepool | North East | 24.2 | 34.5 | 736 |
| Crawley | South East | 24.2 | 35 | 889 |
| Guildford | South East | 24.3 | 31.4 | 1,411 |
| Redbridge | London | 24.6 | 36.1 | 1,706 |
| Corby | East Midlands | 24.6 | 31.7 | 534 |
| Kingston upon Thames | London | 25.1 | 33.9 | 1,198 |
| Brighton and Hove | South East | 25.3 | 37.8 | 2,488 |
| Blaenau Gwent | Wales | 25.4 | 27.5 | 855 |
| Stevenage | East | 25.5 | 32.5 | 850 |
| Halton | North West | 25.5 | 32.3 | 1,533 |
| Harlow | East | 25.9 | 37.6 | 910 |
| Middlesbrough | North East | 26 | 35.3 | 1,049 |
| Nuneaton and Bedworth | West Midlands | 26.1 | 33.2 | 1,185 |
| Three Rivers | East | 26.4 | 32.4 | 832 |
| Rushmoor | South East | 26.4 | 36.7 | 972 |
| Broxbourne | East | 26.7 | 33.7 | 804 |
| Elmbridge | South East | 26.8 | 35.1 | 1,080 |
| Merton | London | 26.9 | 33.6 | 1,631 |
| North East Lincolnshire | Yorkshire and The Humber | 27.4 | 36.7 | 1,471 |
| Luton | East | 27.6 | 39.3 | 1,238 |
| Dundee City | Scotland | 28.7 | 36 | 1,183 |
| Enfield | London | 29.1 | 39.6 | 1,659 |
| Adur | South East | 29.2 | 38 | 473 |
| Reading | South East | 30 | 38.5 | 1,319 |
| Tamworth | West Midlands | 30.4 | 35.8 | 886 |
NOTE: LAs that couldn’t produce at least 100 speedtests were not included.
Mark is a professional technology writer, IT consultant and computer engineer from Dorset (England), he also founded ISPreview in 1999 and enjoys analysing the latest telecoms and broadband developments. Find me on X (Twitter), Mastodon, Facebook and Linkedin.


« BT and CSW Confirm Next Areas of Warwickshire to Get “Fibre Broadband”
Latest UK ISP News


- FTTP (5525)
- BT (3518)
- Politics (2541)
- Openreach (2298)
- Business (2264)
- Building Digital UK (2246)
- FTTC (2044)
- Mobile Broadband (1975)
- Statistics (1789)
- 4G (1666)
- Virgin Media (1621)
- Ofcom Regulation (1463)
- Fibre Optic (1395)
- Wireless Internet (1390)
- FTTH (1382)


Comments are closed