H1 2018 – Top 10 Fastest National UK Broadband and Mobile ISPs
At this point it’s worth taking a look to see how smaller alternative network (altnet) providers (i.e. those that have built their own physical networks to reach customers – excluding Openreach and Virgin Media) compare with the mainstream national ISPs. Sadly most altnets only have a comparatively niche level of network coverage and limited speedtest data, which means that we can’t offer a very comprehensive list but they are growing.
Almost all of the fixed line altnets tend to build “full fibre” (FTTH/P) infrastructure, which is usually capable of offering Gigabit (1Gbps) class broadband speeds, although the speeds below tend to be lower due to the usual caveats of slow WiFi, package choice (i.e. an ISP may offer 1Gbps but a lot of customers will choose the cheaper and slower packages) and local network load at the time of testing.
In order to save space we’ve adopted a slightly different format below by sticking the 2018 H1 and 2017 H2 results side-by-side in the same columns. NOTE: DL = Download, UP = Upload.
Altnets by Average Speed (2018 H1 vs 2017 H2)
| ISP | 2018 H1 DL (2017 H2) | 2018 H1 UP (2017 H2) | 2018 H1 Top 10% DL (2017 H2) |
| Community Fibre | 154.4Mbps (no data) | 171.6Mbps (no data) | 326.6Mbps (no data) |
| Hyperoptic | 98.8Mbps (94.9Mbps) | 99.8Mbps (84.8Mbps) | 195Mbps (184Mbps) |
| Gigaclear | 73.1Mbps (56.3Mbps) | 70.2Mbps (50.6Mbps) | 130Mbps (102.5Mbps) |
| KCOM | 58.4Mbps (50.1Mbps) | 18.3Mbps (15.1Mbps) | 126.1Mbps (109.1Mbps) |
The fastest three providers above all make use of Gigabit capable Fibre-to-the-Premises (FTTP/H) technology and so it’s not surprise to find that they can deliver significantly faster average speeds than their more mainstream counterparts on page 1 (many of those adopt a mix of slower copper ADSL and hybrid fibre solutions).
The exception above is KCOM in Hull, which is aiming to reach 100% of their network area with FTTP by March 2019 but in the meantime their result will still be bogged down by a large proportion to slower ADSL2+ and FTTC users. This is likely to remain a factor until the day finally comes that they can migrate all users to fibre optic lines.
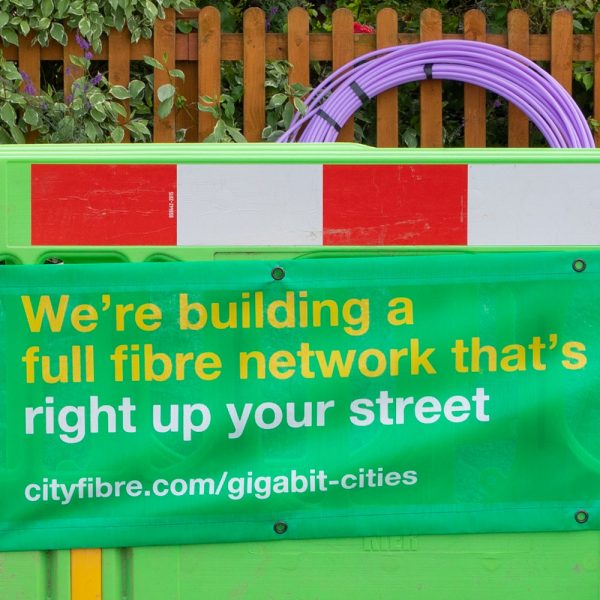
Check out our Summer of Full Fibre Broadband Plans to see who is building what over the next few years.
NOTE: Testing ultrafast connections is particularly difficult, especially on 1Gbps plans, because they can be much more dramatically impacted by restrictions in your local network (e.g. slow WiFi) or with the testing server itself.
The Top Fastest Mobile Network Operators
The fastest Mobile Network Operator is usually the one that has both the best 4G coverage, most advanced network kit and owns the most radio spectrum bands (LTE-Advanced delivers faster speeds by harnessing multiple bands at the same time via Carrier Aggregation), which for now tends to favour EE. Not to mention that having lots of 4G subscribers is a useful bonus for such testing.
In the future the tables may turn as rivals expand their 4G coverage and launch 5G services, although the latter isn’t expected to launch commercially until 2020. The government has also told operators to deliver 95% geographic coverage of 4G by the end of 2022 and this looks like a viable target.
Average Mobile Download Speeds
| No. | Operator | 2018 H1 (Top 10%) |
2017 H2 (Top 10%) |
Change |
| 1. | EE | 27.5Mbps (59.8Mbps) | 26.5Mbps (56.4Mbps) | 3.77% |
| 2. | Vodafone | 18.4Mbps (42.7Mbps) | 19.2Mbps (44.1Mbps) | –4.17% |
| 3. | Three UK | 15Mbps (33.9Mbps) | 16.5Mbps (40.4Mbps) | –9.09% |
| 4. | O2 | 14.6Mbps (32.2Mbps) | 14.4Mbps (31.1Mbps) | 1.39% |
Average Mobile Upload Speeds
| No. | Operator | 2018 H1 |
2017 H2 |
Change |
| 1. | EE | 6.8Mbps | 6.5Mbps | 4.62% |
| 2. | Vodafone | 4.9Mbps | 4.1Mbps | 19.51% |
| 3. | Three UK | 4.4Mbps | 5Mbps | –12% |
| 4. | O2 | 4Mbps | 4.4Mbps | –9.09% |
Overall the average download speed of the four primary mobile operators was 18.87Mbps (down from 19.15Mbps at the end of 2017) and the average upload speed hit 5.02Mbps (up from 5Mbps). As usual we must stress that mobile services are subject to the daily movements and radically differing hardware choices (Smartphones etc.) of their end-users, which makes it difficult to establish a reliable picture of performance.
Nevertheless it appears as if the 4G market is slowly reaching a level maturity in its 4G network design and coverage, although EE’s rivals are still playing catch-up but they’re not as far behind as they were a couple of years ago.
NOTE: Readers can conduct a test of their Internet connection performance via our Speedtest Page, which also contains a simplified summary of the above data including the previous results.
Mark is a professional technology writer, IT consultant and computer engineer from Dorset (England), he also founded ISPreview in 1999 and enjoys analysing the latest telecoms and broadband developments. Find me on X (Twitter), Mastodon, Facebook and Linkedin.


« ISP Freeola Launches G.fast Ultrafast Broadband and Phone Packages
Latest UK ISP News


- FTTP (5525)
- BT (3518)
- Politics (2541)
- Openreach (2298)
- Business (2264)
- Building Digital UK (2246)
- FTTC (2044)
- Mobile Broadband (1975)
- Statistics (1789)
- 4G (1666)
- Virgin Media (1621)
- Ofcom Regulation (1463)
- Fibre Optic (1395)
- Wireless Internet (1390)
- FTTH (1382)


Kc lightstream leaves them all behind 250 mbps Choo Choo
Yeah lightstream pisses on most if not all for speeds and they just keel getting faster