Top 25 UK Local Authorities for Full Fibre Broadband 2018 vs 2017
The latest batch of independent data has revealed the top 25 local authorities across the United Kingdom with the highest availability of ultrafast “full fibre” (FTTP / FTTH) broadband ISP connectivity and their change since 2017. Locations such as Hull, the East Riding of Yorkshire and Cornwall come top.
The data, which has been produced by Andrew from Thinkbroadband, shows that Hull and East Yorkshire have the most coverage in the UK, which are both as a direct result of KCOM’s on-going Lightstream roll-out that is dominated by their ultrafast Fibre-to-the-Premises (FTTP) network (see today’s KCOM news).
Similarly Cornwall also appears near the top, albeit thanks to a huge public-private partnership style investment with Openreach (BT). Funnily enough the situation in Cornwall has also been the subject of an indirectly related news story today (here), which talks more about the local FTTP developments and saves me having to repeat myself.
Advertisement
Meanwhile many of the other areas have been boosted by similar roll-outs from Gigaclear, Hyperoptic, B4RN, Community Fibre, Virgin Media and various other “full fibre” providers. For example, Cityfibre’s joint FTTP deployment alongside TalkTalk in York has clearly had an impact.
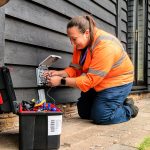
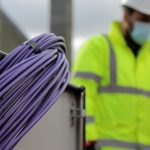
Suffice to say that we are seeing a significant ramping up of civil engineering work, although it will need to go a lot faster to meet the Government’s initial ambition of 15 million premises by 2025 and then nationwide to all by 2033 (here). The latter date would require a huge public investment and is currently just a vague aspiration.
At present just 5% of the UK can access such a network or 1.4 million premises and ideally we need to be adding around 2 million per year just to meet the Government’s aspiration, which is an incredibly difficult task.
Top 25 UK Local Authorities for Full Fibre Broadband
Advertisement
| Rank | Local Authority | % of premises with full fibre (2018) | 2017 |
| 1 | City of Kingston Upon Hull | 84.70% | 58.25% |
| 2 | East Riding of Yorkshire | 39.08% | 36.77% |
| 3 | Cornwall | 35.79% | 31.95% |
| 4 | Tower Hamlets | 35.42% | 27% |
| 5 | City and County of the City of London | 34.75% | 32.35% |
| 6 | York | 32.79% | 24.7% |
| 7 | Ards and North Down | 30.82% | no data |
| 8 | Cotsworld District | 29.19% | 21.18% |
| 9 | Spelthorne District | 28.98% | 27.39% |
| 10 | Newham | 25.44% | 11.94% |
| 11 | West Berkshire | 24.01% | 21.93% |
| 12 | Waltham Forest | 22.24% | 21.27% |
| 13 | Wandsworth | 21.81% | 8.99% |
| 14 | Bournemouth | 20.67% | 20.46% |
| 15 | Rutland | 19.32% | 16.01% |
| 16 | City of Westminster | 19.09% | 10.31% |
| 17 | Sir Ceredigion – Ceredigion | 18.70% | 7.31% |
| 18 | Southwark | 18.56% | 8.82% |
| 19 | Sir Yns Mon – Isle of Anglesey | 18.44% | 12.57% |
| 20 | Powys | 18.13% | 12.13% |
| 21 | Milton Keynes | 18.12% | 13.43% |
| 22 | Fenland District | 17.05% | 0.54% |
| 23 | Tewkesbury District | 16.90% | 3.24% |
| 24 | Gwynedd | 15.58% | 11.71% |
| 25 | South Northamptonshire | 15.41% | 10.39% |
Mark is a professional technology writer, IT consultant and computer engineer from Dorset (England), he also founded ISPreview in 1999 and enjoys analysing the latest telecoms and broadband developments. Find me on X (Twitter), Mastodon, Facebook, BlueSky, Threads.net and Linkedin.


« KCOM Reveal Q4 2018 FTTP Broadband Rollout Plan for Hull UK
INCA Name 16 Finalists for 2018 AltNet Broadband ISP Awards »


Comments are closed