Mixed Results as Ofcom Compares UK Broadband to 18 Major Countries
The telecoms regulator has today published their annual International Communications Market Report 2015 (ICMR), which among other things compares the performance of broadband and telecoms networks in the United Kingdom with 18 other key countries around the world.
As usual it’s important to point out that country-to-country comparisons are complex and time consuming to produce, which is sadly also the reason why Ofcom’s data sources for this report are based on information collected to the end of 2014 (not as recent as last week’s Connected Nations 2015 report).
Advertisement
Otherwise the ICMR compares the UK with 18 other countries, including many of the big players like Germany, France, Italy, Spain, USA, Japan, South Korea, Australia, Sweden, Russia and China etc. The results are somewhat of a mixed bag, with the UK performing well against the biggest four EU states, but poorly when put up next to some of the more advanced countries.
At this point it’s worth reminding readers that the 2010 coalition Government originally said that they wanted the UK to have “the best superfast broadband network in Europe by 2015“, but in 2012 that was watered down (here) by the former Culture Secretary who called for the country to have the “fastest broadband of any major European country by 2015” (i.e. comparing us against France, Germany, Italy and Spain [EU5] – an easily achieved target).
Next Generation Broadband Availability (NGA)
Unsurprisingly hybrid-fibre VDSL (FTTC) broadband technology, which is usually delivered via BTOpenreach’s network, offered the highest population coverage of 79% in the UK. Elsewhere the other hybrid-fibre solutions (FTTLA), such as those delivered via Virgin Media’s cable network, covered a total of 47%. Meanwhile true ultrafast fibre optic (FTTH/P) networks struggled to reach 1%.
Interestingly this means that the UK had the second highest VDSL coverage after South Korea (95%), while Singapore delivered the highest FTTLA coverage at 99% (followed by the Netherlands at 97%) and the top countries for pure FTTH/P were the densely populated Singapore and Japan (95% each).
Advertisement
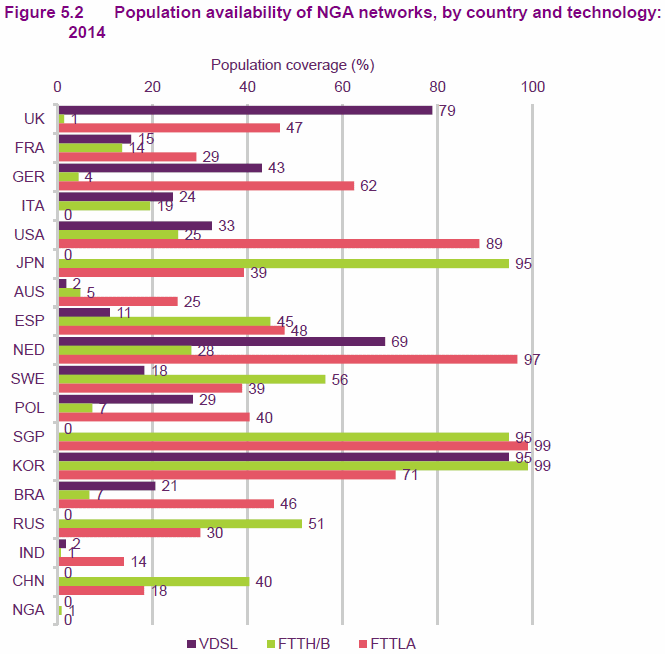
The VDSL solution is popular in the UK because it’s seen as a cheap and quick to deploy service, although it also suffers from more variable speeds and is struggling to keep pace with Virgin Media and other rivals. Future upgrades, such as G.fast technology, may improve matters but will take some years to fully deploy and won’t reach everybody (here).
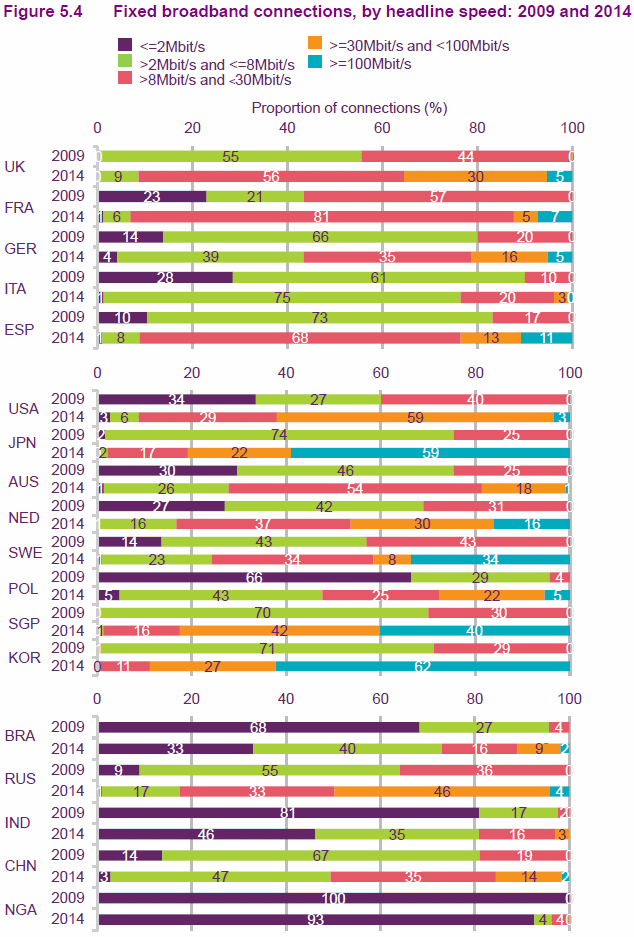
Take note that NGA network coverage is not the same thing as “superfast broadband” (30Mbps+) availability because some areas that are covered by an NGA service can still receive sub-30Mbps speeds, thus Ofcom reflects this separately.
In the UK, 35% of connections had a “headline speed” of over 30Mbps+ at the end of 2014, the 8th highest proportion among all comparator countries and the highest out of the EU5 countries. Mind you it’s worth noting that “headline” speeds can be based off unreliable estimates, which often don’t reflect real-world experiences where actual performance can be slower.
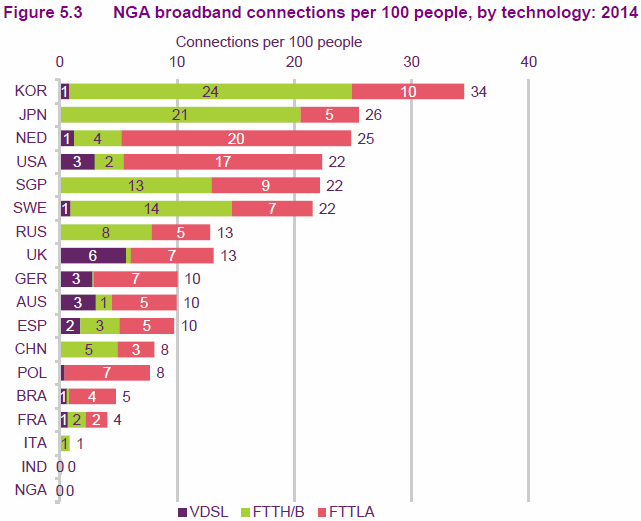
NGA Broadband Take-up
The UK had 13 NGA connections per 100 people at the end of 2014, which ranked us 7th among the other countries (mid-table), which is largely because such services can take several years to fully deploy and some countries are at a much more advanced stage than others. Once again we beat all of the four major EU states, but trail the USA, Russia and Netherlands etc.
Advertisement
The Money Trail
Total retail telecoms revenues across the comparator countries increased by £4bn (0.7%) to £589bn in 2014, albeit mostly thanks to mobile services. As part of this it’s noted that total fixed line voice revenue fell by £9bn (9.5%) to £87bn in 2014, as a result of falling call volumes. Meanwhile total fixed broadband revenue increased by £14bn (12.3%) to £124bn.
Increased data usage also meant that mobile internet revenue (including messaging) increased by £11bn (6.6%) to £173bn, which is almost double the total from 2009 (£87bn).
The US continued to have the highest retail telecoms revenue of all the countries (£172bn), followed by China (£110bn) and Japan (£79bn). By comparison the UK had a slight increase over the same period, up by around £1bn to £29bn. This puts us ahead of France (£19bn), Germany (£25bn), Italy (£16bn) and Spain (£14bn).
It’s worth noting that most of the major EU5 states actually saw a big decline in retail telecoms revenue since 2009, only the UK and Germany have held fairly steady. Most other countries echoed the UK by showing a small to modest improvement.
The UK was also one of four countries (along with Singapore, South Korea and Brazil) where the number of fixed exchange lines actually increased in the five years to 2014, up by 2 million to 39 million (an average increase of 1.4% annually). The UK’s boost was mostly “due to strong demand for xDSL access” (ADSL, VDSL broadband etc.). Every other country reported a decline of around 2% overall.
Unsurprisingly then the UK also had the seventh-highest fixed broadband revenue of all the comparator countries in 2014, at £5bn (in line with Australia and South Korea), and the highest among the EU5 countries. Fixed broadband revenues were highest in the US at £34bn, followed by Japan and China (at £25bn and £24bn respectively). Overall every country, except Nigera and Italy, saw their fixed broadband revenues grow and the UK went up at a fairly average rate of 7.7% per year in the five years to 2014.
Similarly the average monthly telecoms spend per person ranged from £1 in India to £53 per person in Australia. Interestingly the average spend per head fell in the UK (by 0.3%) to £37 per person, which means we were the fifth highest (expensive) of all the countries.
Broadband is actually fairly well priced in the UK, thus the cost impact mostly stems from our expensive voice calls, mobile services and phone line rental. In the UK, average fixed broadband revenue averaged £6 per person, equal with France and the Netherlands (one of the lowest).
Meanwhile the per-capita spend on mobile services ranged from less than £1 per month in India to £33.22 per month in Singapore in 2014. The UK’s spend was £19.75, the eighth highest spend out of the comparator countries.
Other Stuff
Ofcom’s report is vast and so we’ll finish up with a few interesting statistics.
Some Other Highlights
* Average monthly per-capita fixed broadband data use in GigaBytes was highest in South Korea at 48.6GB per person in 2014 (over twice that in 2009), followed by Japan at 32.3GB per person (also more than double the 2009 average) and Sweden at 31.5GB per person. Of the 18 comparator countries, the UK had the fifth highest average data volumes in 2014, at 22.3GB per person, up 64% on the previous year.
* Some 82% of UK respondents were satisfied with their overall service, the highest proportion among all of the countries. At least three-quarters of respondents in the UK were also satisfied with every other measure of fixed broadband service (download speed 77%, upload speed 76% and reliability 76%). Funnily enough respondents in Japan were the least satisfied, with 55% of respondents being satisfied with their service overall.
* Singapore had the highest number of mobile internet (excluding messaging) connections per 100 people in 2014, at 183 connections (they sure do love mobile services!). By comparison the UK had 87 connections per 100 people, ranking us a middling 8th overall.
* The UK had the highest per-capita spend on e-commerce in 2014, at £1591 per head. E-commerce expenditure per head in the UK was over 50% higher than in the US, the next highest-valued market, which had an average spend of £918 per head.
The full report can be read here, assuming you have the time or sanity to conquer it.
Mark is a professional technology writer, IT consultant and computer engineer from Dorset (England), he also founded ISPreview in 1999 and enjoys analysing the latest telecoms and broadband developments. Find me on X (Twitter), Mastodon, Facebook, BlueSky, Threads.net and Linkedin.
« UPD Cotswolds Broadband Prep Spring 2016 Rollout in West Oxfordshire







Comments are closed