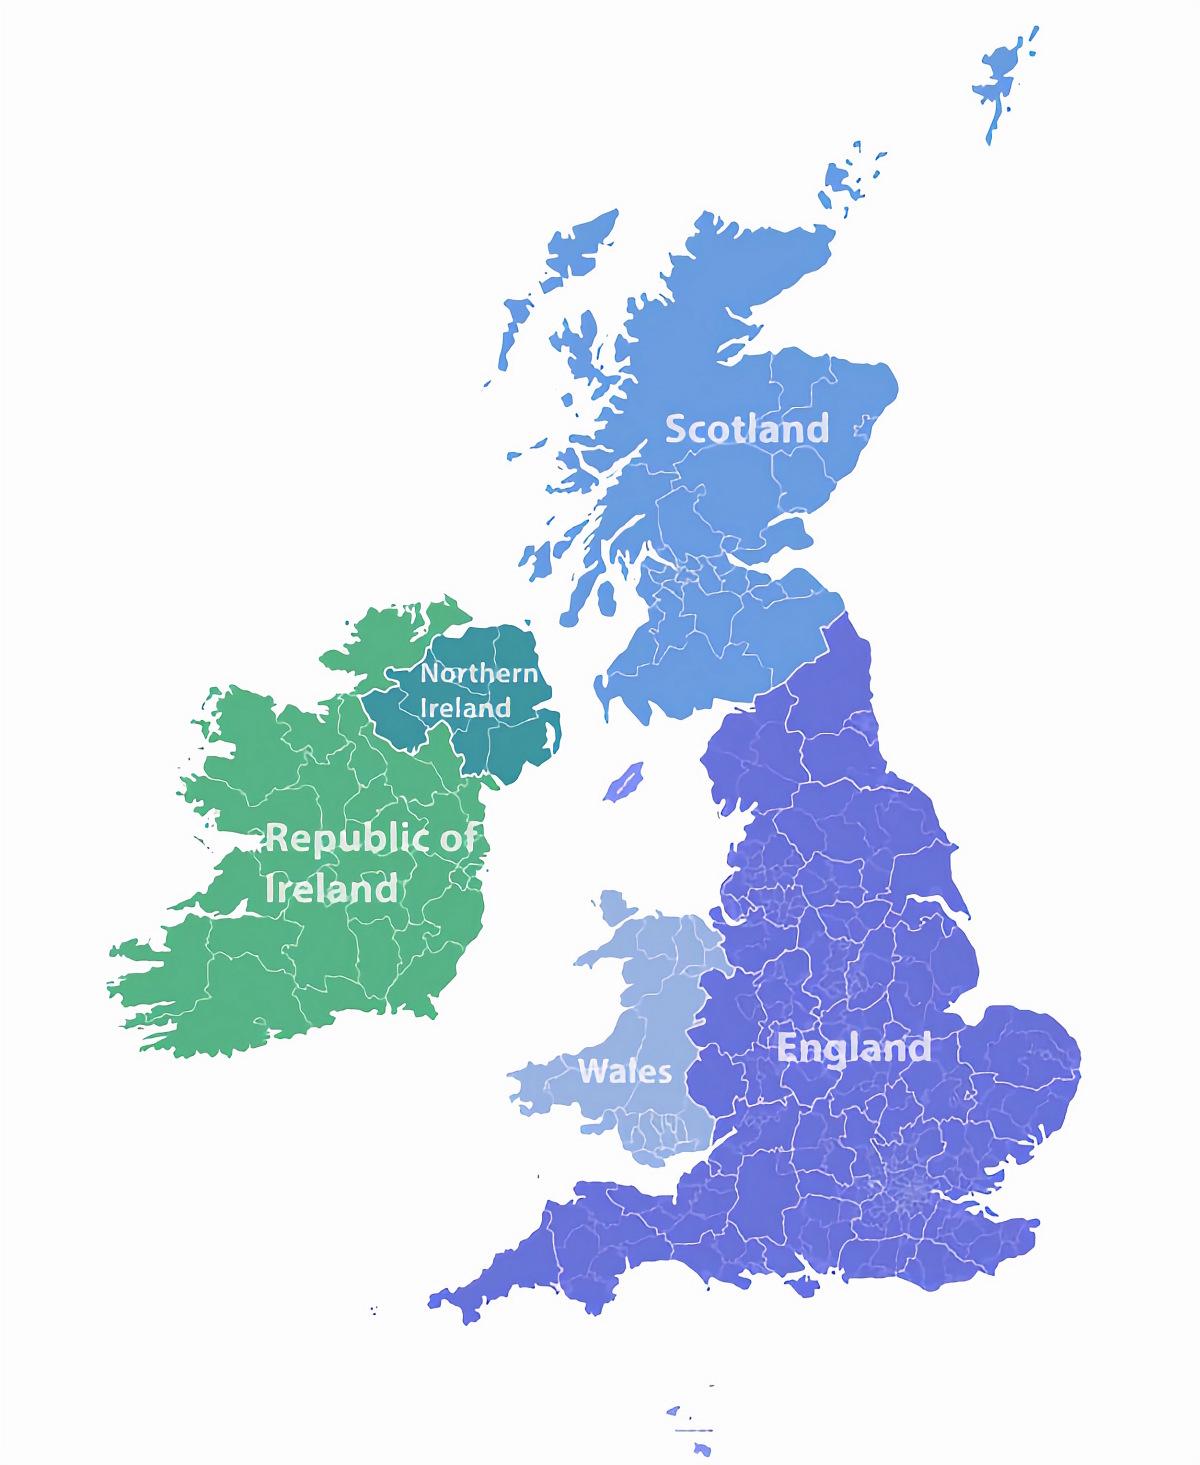
Councils Complain About England’s Below Average Broadband Speeds
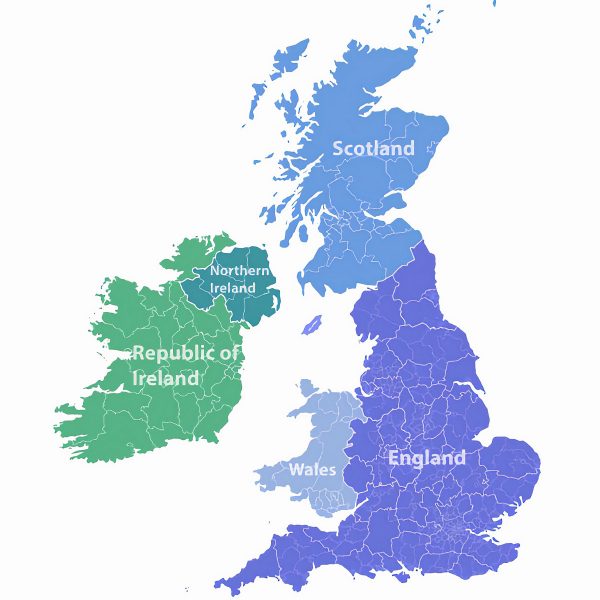
The County Councils Network (CCN), which highlights itself as the “national voice” for England’s 37 county councils, has today claimed that 72% of the country’s counties are below the national average download speed of 45Mbps and 27% have average speeds below Ofcom’s 30Mbps+ definition of “superfast“.
According to CCN’s analysis, broadband speeds in rural areas are lagging up to three times slower than neighbouring cities only a few miles down the road, with council leaders warning they are at a “competitive disadvantage” to urban areas. The highest speed in England was found to be 102.9Mbps in York, whilst the lowest average speed is 21.8Mbps in West Devon.
This is of course nothing new because it tends to cost significantly more to deploy faster broadband networks into sparse rural communities (commercially operators often struggle to get a good return on their investment), hence why the government’s £1.6bn+ state aid supported Broadband Delivery UK programme exists.
CCN goes on to argue that counties should have similar powers to drive forward local economic growth as city region metro-mayors, working as “strategic authorities” alongside Local Enterprise Partnerships (LEP), and should get a “fairer share of infrastructure investment which is currently skewed towards urban areas“.
Unfortunately CCN doesn’t state what sort of speed England should be aiming for or answer the question of how much £££ is needed and who pays, as well as over what sort of time-scale. A bit more detail from CCN here on what they’d do differently and why it would be better might have helped to support the case.
Philip Atkins, CCN Vice-Chairman and leader of Staffordshire Council, said:
“The government’s commitment to provide superfast broadband to as many areas in England as possible has resulted in some significant steps forward in rural connectivity in the last few years. Counties like Staffordshire are working with national and local partners to connect hard to reach rural areas and improve broadband connectivity.
Counties are great places to live and work, but these figures show that businesses in shire counties and rural areas are being left at a competitive disadvantage. It cannot be right that in some areas, businesses and residents in a city less than 10 miles down the road from a rural county benefit from average download speeds of more than three times faster.
While the government has announced investment in this area, we remain concerned that digital infrastructure in counties isn’t getting the attention it desperately needs. The ultimate success of the government’s Industrial Strategy will hinge on ensuring we drastically improve national productivity in all four corners of the country post-Brexit. This means ensuring we invest in digital infrastructure.
More investment is only part of the answer; county authorities need to be empowered as ‘strategic authorities’, alongside city region metro mayors, with devolved powers to drive forward infrastructure investment in their areas. The government’s promised ‘common devolution framework’ is an opportunity to ensure a practical framework for achieving this, placing county authorities as lead, accountable bodies as recommended by leading think-tanks Localis, ResPublica and IPPR.”
The analysis notes that example locations in North Yorkshire have an average download speed of 30.2Mbps, compared to neighbouring York’s average speed of 102Mbps. Similarly Ryedale shares a boundary with the city of York, yet residents and businesses in Ryedale get average speeds of less than one fifth (25.8Mbps) of those enjoyed in the city. Various similar examples are also highlighted.
For example, areas within Derbyshire have an average download speed of 31.6Mbps, almost half of that of the county’s city, Derby, which has average download speeds of 59.3Mbps. Just a few miles north of the city, residents and businesses in Amber Valley have average speeds of just 25.9Mbps.
Average Download Speed by Area
| Area type | Average download speed (Mbit/s) |
| England average | 45 |
| Non-county unitaries | 54.05 |
| Metropolitan boroughs | 48.54 |
| London boroughs | 47.71 |
| Counties | 37.65 |
Average download speeds in individual county areas
| County area | Average download speed (Mbits/s) |
| Hertfordshire | 58.1 |
| Nottinghamshire | 54.4 |
| Surrey | 51.2 |
| Hampshire | 48.8 |
| Central Bedfordshire | 48.5 |
| Northamptonshire | 48.2 |
| Leicestershire | 47.9 |
| Oxfordshire | 46.3 |
| Gloucestershire | 45.9 |
| Cambridgeshire | 45.5 |
| Warwickshire | 43.3 |
| West Sussex | 43.2 |
| Lancashire | 40.9 |
| Staffordshire | 40.2 |
| Buckinghamshire | 39.9 |
| East Riding of Yorkshire | 39.5 |
| Kent | 38.4 |
| Essex | 38.2 |
| Wiltshire | 38.1 |
| Worcestershire | 36.7 |
| Cheshire East | 36.5 |
| Lincolnshire | 36.2 |
| Norfolk | 33.9 |
| Cheshire West & Chester | 32.8 |
| Suffolk | 32.5 |
| Derbyshire | 31.6 |
| North Yorkshire | 30.4 |
| Dorset | 29.6 |
| Devon | 29 |
| Cumbria | 28 |
| Durham | 26.9 |
| East Sussex | 26.9 |
| Shropshire | 26.3 |
| Northumberland | 25.9 |
| Somerset | 25.3 |
| Cornwall | 24.2 |
| Herefordshire | 24 |
As usual there are a few potential issues with the CCN study. Firstly, we should point out that the figures referencing individual areas within counties and cities are based off Ofcom’s data of individual local authorities, collated in May/June 2017 and used in their Connected Nations 2017 report. Among other things this data is now nearly a year out of date.
The average county area figures are similarly based on CCN’s own analysis of the figures, compiled by Grant Thornton UK LLP, that are again based on Ofcom’s old data. However they appear to be using a ‘mean‘ rather than ‘median‘ average in their findings (it’s often handy to see both).
As for Ofcom’s estimated speeds, these are based off data supplied by ISPs rather than speedtests. CCN informed ISPreview.co.uk that this availability data also includes coverage information provided by alternative network (AltNet) providers, although we suspect that Ofcom doesn’t have data from all of the available ISPs and networks in every single area.
Some areas can of course access multiple different network types but the above results, which focus on an average, might not be fully reflecting whether a Gigabit capable FTTP/H network from B4RN, Gigaclear or even Openreach etc. exists.
We should also point out that the UK Government’s definition of “superfast broadband” for Phase 1 and many, but not all, Phase 2 BDUK contracts (the very latest all adopt 30Mbps+) is still officially 24Mbps+, which in the grander scheme of things isn’t too different from using the Ofcom / EU’s definition of 30Mbps+ but it would change some of CCN’s opening remarks.
Crucially it’s important to state that estimated service speeds do not always sync correctly with real-world experiences or actual network availability (they can be better but are often worse). The BDUK programme claims to have made 24Mbps+ capable networks available to 95%+ of UK premises and the expectation is for this to reach around 98% by 2020, with the final 2% then being catered for via a 10Mbps+ USO (Details).
Lest we forgot the importance of take-up. Today less than half of all home broadband lines are still connected via slower ADSL services, even though faster networks are often available (i.e. a lot of people haven’t upgraded due to various reasons such as a lack of awareness, higher prices, fear of switching, satisfaction with their existing connection etc.).
Mark is a professional technology writer, IT consultant and computer engineer from Dorset (England), he also founded ISPreview in 1999 and enjoys analysing the latest telecoms and broadband developments. Find me on X (Twitter), Mastodon, Facebook and Linkedin.


« Q1 2018 OpenSignal Report Awards EE as Best UK Mobile Operator
Latest UK ISP News


- FTTP (5530)
- BT (3518)
- Politics (2542)
- Openreach (2298)
- Business (2266)
- Building Digital UK (2247)
- FTTC (2045)
- Mobile Broadband (1977)
- Statistics (1790)
- 4G (1668)
- Virgin Media (1621)
- Ofcom Regulation (1465)
- Fibre Optic (1396)
- Wireless Internet (1391)
- FTTH (1382)


Average speeds are very different to average available speeds. Many people can improve their download speed by upgrading to FTTC/FTTP etc. But many have not upgraded. Lots of reasons but one of the main ones appears to be money i.e. people unwilling or unable to spend a little extra each month. If we want more we have to be willing to pay more. Another reason is lack of knowledge that they can upgrade.
Cornwall is a good example, lots of FTTP coverage but a low uptake %.
This isn’t the case for everyone and rural populations are less likely to have upgrade options. But this is changing.
“competitive disadvantage” is an interesting term. This claim could have been made for the last 100 years or more. By their very nature, rural locations have poorer transport links, access to a smaller workforce and more likely to be affected by extreme weather. The list goes on and on.
On the flip side, rural areas enjoy less congestion, better air quality, reduced crime etc.
Same old debate. Everyone wants a universal service but looking for someone else to pay for it. With the current full Fibre rollouts the divide between rural and urban will only increase. Yes there are schemes for local communities but it takes a lot of time and commitment by dedicated individuals.
Current ISP pricing appears to encourage FTTC. The differential between FTTC and ADSL should really be bigger now as the ADSL investment has been there for some time. If ADSL services (which are more resilient to sustained power outage) were cheaper then doubling up lines (balanced WAN) would become an option for some. I still think there is still a lot more we can do technically.
Whether the funding comes from Central or Local Government rural areas will need subsidy. If it is not going to be enough then perhaps we should have a modest levy on those that are fortunate to have Ultrafast and Hyperfast.
What I wouldn’t want to subsidise is someone who has decided to build a data centre on an old wood yard formerly supplied with a telephone line over 7 strands of drop wire. Same rules should apply for Water, Gas, Electricity and Comms on new sites.
As you pointed out if Ofcom used median instead of mean as an average it would be a better guide to the speeds most people get, but even then innumerate councillers would still be complaining that half of them get less than the average speed.
‘innumerate councillers’
Priceless.
or ‘why do I get less than someone who gets more?’
Average doesn’t mean the 50th percentile unless you’re talking about the Normal Distribution.
Broadband speeds do not follow the normal distribution.
For my postcode in Rotherhithe, Ofcom reported 20 connections getting 40-80 Mbit/s download (from close FTTC, installed just four months earlier) and 19 connections getting 1-4 Mbit/s (not yet upgraded from ADSL). Not very surprisingly, the cabinet was at full capacity two months after that and a second cabinet installed three months later
So Ofcom reported a median of 40 Mbit/s and an average of about 32 Mbit/s. If one fewer person had upgraded, it would have reported a median of 4 and average of about 30. So it is not obvious to me that the median is always a better statistic
“Unfortunately CCN doesn’t state what sort of speed England should be aiming for or answer the question of how much £££ is needed and who pays, as well as over what sort of time-scale. A bit more detail from CCN here on what they’d do differently and why it would be better might have helped to support the case.”
Would it be uncharitable to suggest that complaining about BB (using older and therefore more extreme examples) is far easier than producing worked through solutions.
Why do different outfits go through the same process, with different results at additional cost?
Live in North Wales just over the Boarder in Wrexham. We have been lucky that the hole town was FTTCed under the Welsh government. However the only CABs in town to be FTTP were the Councils! My expectation is that there will be no further upgrades until the Whole town is VM, who already have a foothold in town. But speeds out on the rim were dire!
The real issue here is missing..
The elephant in the room is geographical i.e. the distance from you to your Cabinet etc.
Here in North Yorkshire for example before all the BDUK rollouts 95% geographically of the area had very poor service. Phase 2 is now complete but geographically the figures have barely changed because the settlements/cabinets are so far apart meaning now 90% geographically has a poor 0-10 Mbps service. I would expect many other rural counties are similar. On the ground it means if you are more than a mile and a bit from a cabinet you get a crap service barely usable these days where upload is increasingly important and certainly not fit for purpose.
The Geographical coverage element was played down in the criteria of the phase 3 procurement in North Yorkshire; favouring speed. It is not really addressing the problem let alone the forthcoming USO of min 10 Mbps. Phase 3 will cost from £2300 per premise passed…so with 25% take up that is nearly 10 grand to connect 1 person… value for money? political expediency?
Mobile to the rescue?
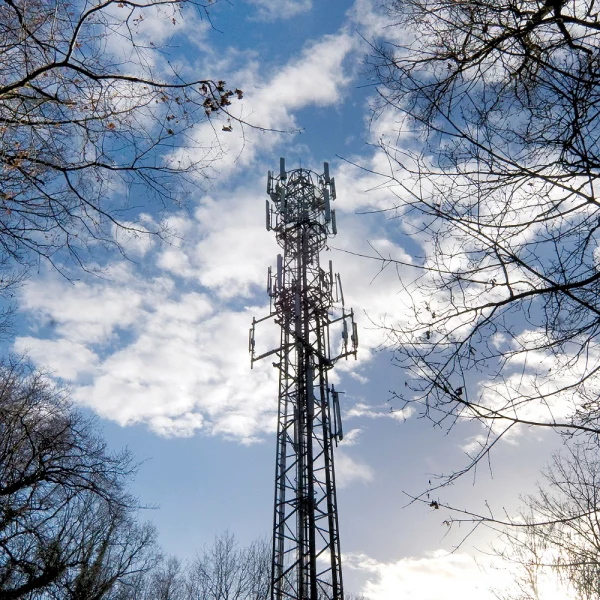
4G cover is even more patchy and rarely useful in this uncovered 90%. The big operators are focused on 5G and besides the £billions put aside for today’s auction result, more is needed for a massive rebuild with 7000 new stronger towers to take the weight of the new 5G larger number of radios and antennae on them.
Perhaps it would be more realistic to have 2 sets of coverage numbers; premise AND geographic so for North Yorkshire for example 95% premise 10% geographic would be revealing
We are hearing no solutions for this 90%.
Each drawn out BDUK public procurement taking near 2 years from Open market review to public maps of rollout which tends to freeze, close down and discourage small operators. Then within months the next procurement begins!!
We have not really got a grip on the 4th utility and if there is any time when leadership is needed for USO and 90% of our countryside…. its NOW
On a similar previous occasion Roosevelt’s ‘New Deal’ brought together folks in the farming and rural communities to form co-ops with low cost loans to bring electricity to their communities. Many of those companies are still thriving today and offering broadband in addition. B4RN and others have proved what the word ‘community’ can achieve. Farmers and their neighbours have always worked together.
NJH From the sticks a few miles outside York, the fastest city in the land…Huh!
Sorry but why is geographic coverage relevant for a fixed service? All that matters is the % of premises covered, it’s not as if you need the service on the move, that’s what mobile is for.
North Yorkshire currently has around 90% superfast coverage, leaving 10% of premises for later BDUK phases or the USO. From your own stats, those left to the USO will probably need to make a contribution towards the cost as most, possibly all, will exceed the cost cap.
In reality I’d expect many to take advantage of 800MHz coverage on 4G, use an external aerial from EE and pay £100 install cost instead of substantially more for a fixed line.
@Nick Hall: This is a sign that your rural county is using the wrong technology and hasn’t done its homework. VDSL might be sufficient for the time being in densely populated clusters, but not for rural areas. Other technologies such a fixed wireless or FTTP would have been more appropriate for your rural areas. Your local county probably only considered BT with its (in this case wrong) approach of ‘one size fits all’.
@GNewton
Any thoughts on the cost per premise if the council had opted for FTTP instead of FTTC for the coverage to date? How much less than 90% would have been covered for the available budget?
As for fixed wireless, how many premises would be reached per transmitter and at what cost?
Since you’re so certain with your response, no doubt you have this detail so why not share?
@New_Londoner: Your question is misleading. This is about rural broadband. Why do you think for long rural lanes VDSL is easier to deploy than FTTP, especially for EO lines? VDSL simply can’t serve certain rural areas. There is a reason why various BDUK projects started including fibre providers like Gigaclear instead of BT. Your idea of ‘one size fit all’ doesn’t work here.
1.8MB connection to the internet here but never any mention of that.
Cheshire, Shropshire, Herefordshire…
…not surprising that counties bordering on Wales have such shit speeds.