RSC Map Shows Best and Worst 20 UK Areas for Broadband Speed
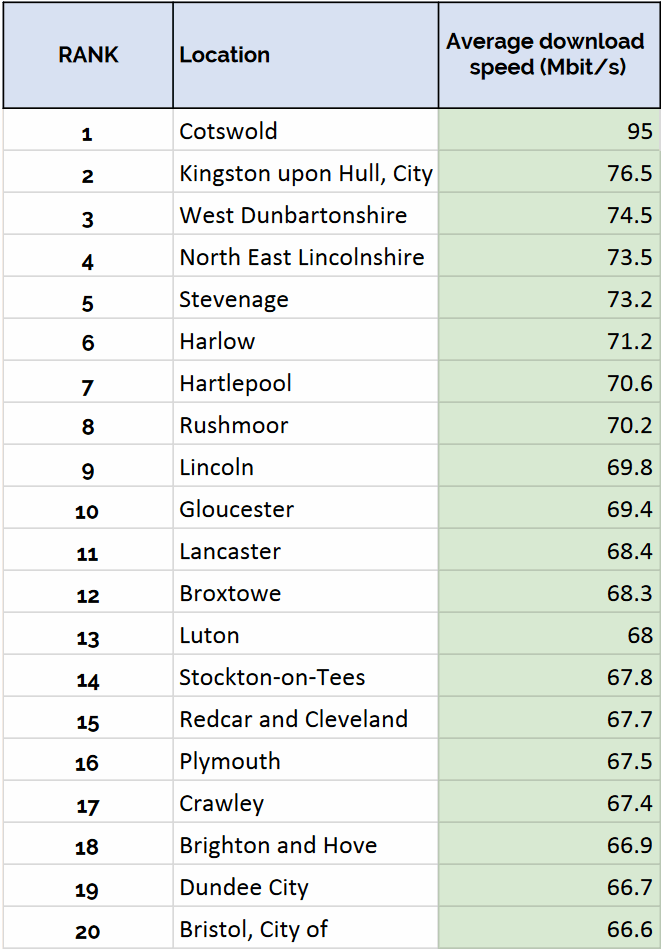
RS Components have used data from Ofcom’s Connected Nations report to create a new interactive map, which reveals the top 20 UK locations for average fixed line broadband ISP download speeds. Apparently the Cotswolds comes out on top with a speed of 95Mbps, while the City of London is named the slowest on 17.1Mbps.
At this point we note a rather obvious flaw in RSC’s results because surely the slowest locations in the UK would be those that continue to suffer from sub-2Mbps speeds (usually remote rural areas and some disadvantaged urban locations), which is usually due to the presence of long copper ADSL lines as the only means of fixed line connectivity (around 0.5% of premises may be in this boat).
Admittedly connectivity in the central City of London area is notoriously poor but it does have some coverage from alternative full fibre networks (e.g. Hyperoptic) and Virgin Media’s cable service, while Openreach has a bit of FTTC in the area too. Overall roughly half of this area can access “superfast broadband” (30Mbps+) speeds and that’s more than some other locations, albeit still extremely weak.
Advertisement
Meanwhile the fastest locations would be those with a high availability of Virgin Media’s cable, Openreach’s G.fast or general full fibre (FTTH/P) connectivity, such as places like Hull and East Riding (East Yorkshire) where KCOM’s FTTP network is at almost universal availability. On this front the Cotswolds does have a fair bit of FTTP from Gigaclear, Openreach and others (plus a lot of slower FTTC) but its nowhere near to the same extent as Hull, yet Hull comes second below.
Perhaps one reason for the odd results is that Ofcom tends to use a mix of different speed data in their reports, which can be based around available advertised rates, “sync” speeds or general estimates of line performance. Sadly RS Components has not clarified precisely what type of data they’ve used from the regulator or their methodology. Similarly they haven’t balanced it by showing the network availability of faster services in each location.
The above issues mean we’re not quite sure how to reference these results, so take them with the usual pinch of salt. You can check out their interactive map online and we’ve pasted the top 20 results below.
Top 10 fastest broadband speed locations around the UK
Advertisement
Top 10 slowest broadband speed locations around the UK

Mark is a professional technology writer, IT consultant and computer engineer from Dorset (England), he also founded ISPreview in 1999 and enjoys analysing the latest telecoms and broadband developments. Find me on X (Twitter), Mastodon, Facebook, BlueSky, Threads.net and Linkedin.


« O2 and Vodafone Finalise UK Agreement to Share 5G Active Equipment


Comments are closed