Openreach Shows BIG Increase in UK Data Traffic Over Past Year

Network access provider Openreach (BT) has just posted a summary of the internet download and upload (data) traffic that has passed across their national UK broadband infrastructure between December 2019 and March 2021, which helps to highlight just how much data we’re all gobbling vs before the COVID-19 pandemic.
Openreach typically supplies numerous broadband ISPs, mobile operators and other networks across the country. As a result of all that their network often sees the impact of big events, as well as any key changes in consumer or business behaviour.
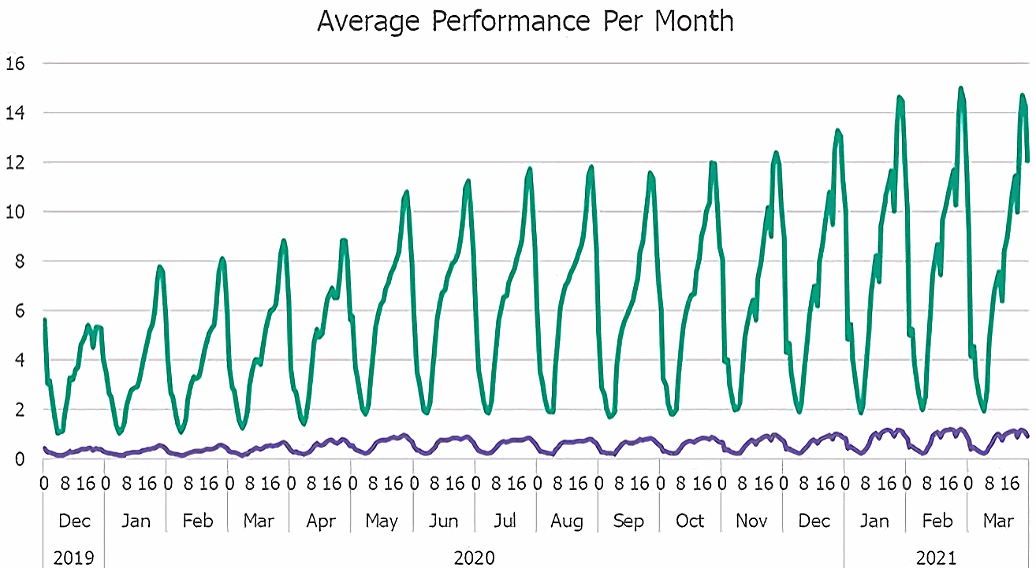
The operator’s latest update reveals that broadband usage peaked in February 2021 with a record of 5,474 PetaBytes (PB) being consumed across their network, which is an increase of 2,702 PB in comparison to February 2020 (2,772 PB). The dark green line below represents downstream traffic, while the purple line reflects upstream.
Advertisement
In a brief statement Openreach said, “Our network continues to cope well with the increased demand of home working and home schooling due to the pandemic.” We should point out that demand for data is constantly rising and so new peaks of usage are being set all the time by every ISP (usage typically grows by 30%+ each year), although the COVID-19 lockdowns of 2020/21 have certainly given the usual trends a bit of a push.


Mark is a professional technology writer, IT consultant and computer engineer from Dorset (England), he also founded ISPreview in 1999 and enjoys analysing the latest telecoms and broadband developments. Find me on X (Twitter), Mastodon, Facebook, BlueSky, Threads.net and Linkedin.


« Ofcom UK Makes Changes to Rules for Landline and Mobile Calls
Virgin Media Extend FTTP to 5400 Homes in Burton upon Trent »


This shows why caching of video data close to the user is an essential management technique of modern networks/ISPs to support data transmission.
Without caching Netflix/Amazon/YouTube/BT Sport streaming have been in meltdown with constant complaints of buffering.
Be careful what you wish for.
I recall numerous occasions in around 2012-2017 where Virgin Media’s YouTube cache servers have buckled under the load and even people with 100Mbps+ connections have had problems streaming 240p quality videos.
It usually took Virgin a few weeks to pull their finger out and fix the cache servers.
In the mean time enabling a VPN would bypass the cache servers and fix these streaming woes.
Do you trust ISPs to maintain good cache servers?
Surprised how little upstream has grown, given that folks are now making lots of HD video calls from home. I guess it’s dwarfed by consumption of streaming services like Netflix. Guessing the “jump” in December and January is lots of people upgrading TVs from 1080p to 4K over Black Friday / Christmas / Boxing Day sales?
I’d guess it was due to the Christmas/new year holiday and the national lockdown
I’m trying to understand the graph. What is “Average Performance” and what does the y-axis represent?
Sadly, Openreach aren’t terribly good at putting out graphs with labels and useful descriptions. The Y axis shows Usage in PB, but I’m not 100% sure of their approach to displaying the averaged usage over time above. The data looks compressed to show the monthly high/low trends.
Or you’re not terribly good at asking them what the graphs mean before publishing them 😉
Thanks!
I think the x-axis is “time-of-day in a given month”. So, “16” in “Aug” represents the average upload / download rate at 4pm averaged across all days in August.
Could be wrong, but it’s plausible with peaks in the evening and troughs at night.
No more getting our connections being throttled on purpose… question is though when is this going into full effect? I’ve seen multiple OpenReach vans in my area all over the place, saw like 3 OpenReach vans like for 2weeks a couple months back, saw the odd few last week. But when is Full Fiber gonna be available to all?
I did post something like this last time, swear I got no answer.