New Broadband Index Ranks 334 UK Areas by Average DL Speed

Comparison site Comparethemarket.com has posted an updated analysis of Ofcom’s Connected Nations 2019 data (here), which uses information supplied by UK ISPs to rank 334 local authorities by their average broadband download speed. Naturally Hull (East Yorkshire) tops the list with 131.4Mbps and the biggest annual rise of 54.9Mbps.
Meanwhile, at the other end of the scale, the Orkney Islands (Scotland) were noted to be the slowest local authority with an average speed of 28.7Mbps, although they did see an annual performance improvement of 6Mbps. By comparison Daventry (Northamptonshire) recorded a respectable average of 46.1Mbps, but they were also the least improved and indeed reported a negative fall of -14.7Mbps over the year.
Nobody will be surprised to see Hull in the top position here because last year saw KCOM complete their initial £85m Lightstream programme, which has spent several years deploying 1Gbps capable Fibre-to-the-Premises (FTTP) technology across virtually their entire network patch of c.200,000 premises. The operator is now expanding this outward into new areas as part of a fresh investment of £100m (here).
Advertisement
The average speeds being reported here appear to be based on Ofcom’s Connected Nations 2019 report (here), which used data supplied by UK ISPs and based “on the number of connections providing an active broadband service.” Sadly upload speeds were not considered.
One key caveat above is that the average may not reflect the best possible speed available in each area, but rather the take-up of different packages (e.g. an ISP may offer 1Gbps plans but consumers could be taking slower tiers and that would reduce the average).
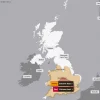
The Results
Take note that the following table is ranked by average download speed for 2019, although it excludes any mention of Bournemouth, Poole or Christchurch in Dorset because those three local authorities were combined into a single authority last year and unfortunately this skews the data (hopefully Dorset will be represented again in the future).
On top of that London’s various Boroughs only appear in their own table, although at the time of checking that list appeared to be blank (they’ve since fixed it). Despite this Camden is said to have seen the biggest rise from 56.7Mbps in 2018 to 77.7Mbps in 2019 (annual improvement of 21Mbps), while the City of London only saw an annual improvement of 7.3Mbps to reach an average of 24.4Mbps.
Advertisement
| Rank | Local Authority | County | 2018 Avg. Mbps | 2019 Avg. Mbps | Yearly Change (Mbps) |
| 1 | Kingston upon Hull | East Riding of Yorkshire | 76.5 | 131.4 | 54.9 |
| 2 | Corby | Northamptonshire | 55.8 | 92.9 | 37.1 |
| 3 | West Dunbartonshire | West Dunbartonshire | 74.5 | 92.4 | 17.9 |
| 4 | Stevenage | Hertfordshire | 73.2 | 90.4 | 17.2 |
| 5 | Harlow | Essex | 71.2 | 88.6 | 17.4 |
| 6 | Crawley | West Sussex | 67.4 | 88.4 | 21 |
| 7 | North East Lincolnshire | Lincolnshire | 73.5 | 88.3 | 14.8 |
| 8 | Lancaster | Lancashire | 68.4 | 87.4 | 19 |
| 9 | Rushmoor | Hampshire | 70.2 | 85.5 | 15.3 |
| 10 | Luton | Bedfordshire | 68 | 84.2 | 16.2 |
| 11 | Lincoln | Lincolnshire | 69.8 | 84 | 14.2 |
| 12 | Portsmouth | Hampshire | 66.4 | 83.7 | 17.3 |
| 13 | Hartlepool | County Durham | 70.6 | 83.6 | 13 |
| 14 | Gloucester | Gloucestershire | 69.4 | 83.5 | 14.1 |
| 15 | Inverclyde | Inverclyde | 65.3 | 83.4 | 18.1 |
| 16 | Brighton and Hove | East Sussex | 66.9 | 83.4 | 16.5 |
| 17 | South Gloucestershire | Gloucestershire | 64.1 | 82.7 | 18.6 |
| 18 | Broxbourne | Hertfordshire | 66 | 82.6 | 16.6 |
| 19 | Cambridge | Cambridgeshire | 66.6 | 82.6 | 16 |
| 20 | Worthing | West Sussex | 65.3 | 82.2 | 16.9 |
| 21 | Stockton-on-Tees | County Durham | 67.8 | 82.1 | 14.3 |
| 22 | Plymouth | Devon | 67.5 | 82 | 14.5 |
| 23 | Dundee City | Dundee | 66.7 | 81.5 | 14.8 |
| 24 | Bristol | Bristol | 66.6 | 81.3 | 14.7 |
| 25 | Broxtowe | Nottinghamshire | 68.3 | 81.1 | 12.8 |
| 26 | Hart | Hampshire | 60.7 | 81 | 20.3 |
| 27 | Surrey Heath | Surrey | 63 | 80.9 | 17.9 |
| 28 | Nottingham | Nottinghamshire | 66 | 80.8 | 14.8 |
| 29 | Watford | Hertfordshire | 64.7 | 80.5 | 15.8 |
| 30 | Redcar and Cleveland | North Yorkshire | 67.7 | 80.5 | 12.8 |
| 31 | Falkirk | Falkirk | 66.2 | 80.4 | 14.2 |
| 32 | St. Helens | Merseyside | 63.6 | 80.3 | 16.7 |
| 33 | Medway | Kent | 65.7 | 80.1 | 14.4 |
| 34 | Middlesbrough | North Yorkshire | 66.4 | 80.1 | 13.7 |
| 35 | Belfast | Belfast | 64.7 | 79.8 | 15.1 |
| 36 | Woking | Surrey | 64.8 | 79.8 | 15 |
| 37 | Adur | West Sussex | 66.2 | 79.5 | 13.3 |
| 38 | North Lanarkshire | North Lanarkshire | 62.8 | 79.4 | 16.6 |
| 39 | Redditch | Worcestershire | 62.8 | 79.4 | 16.6 |
| 40 | Darlington | County Durham | 65.8 | 79.3 | 13.5 |
| 41 | Gedling | Nottinghamshire | 65.2 | 78.7 | 13.5 |
| 42 | East Dunbartonshire | East Dunbartonshire | 64.2 | 78.3 | 14.1 |
| 43 | Peterborough | Cambridgeshire | 59.6 | 77.8 | 18.2 |
| 44 | Solihull | West Midlands | 62.2 | 77.6 | 15.4 |
| 45 | Three Rivers | Hertfordshire | 63.2 | 77.6 | 14.4 |
| 46 | City of Edinburgh | Edinburgh | 63.1 | 77.4 | 14.3 |
| 47 | Havant | Hampshire | 65.2 | 77.4 | 12.2 |
| 48 | Tamworth | Staffordshire | 59.5 | 77.2 | 17.7 |
| 49 | Ashfield | Nottinghamshire | 65 | 77 | 12 |
| 50 | Renfrewshire | Renfrewshire | 59.4 | 76.8 | 17.4 |
| 51 | Stockport | Greater Manchester | 63.4 | 76.7 | 13.3 |
| 52 | Northampton | Northamptonshire | 62 | 76.4 | 14.4 |
| 53 | Oxford | Oxfordshire | 62.9 | 76.4 | 13.5 |
| 54 | Bedford | Bedfordshire | 58.3 | 76.2 | 17.9 |
| 55 | Cardiff | Cardiff | 61 | 76.1 | 15.1 |
| 56 | Derby | Derbyshire | 64 | 76.1 | 12.1 |
| 57 | Dudley | West Midlands | 60.2 | 76 | 15.8 |
| 58 | Gosport | Hampshire | 62.8 | 75.9 | 13.1 |
| 59 | Hertsmere | Hertfordshire | 60.8 | 75.6 | 14.8 |
| 60 | Leicester | Leicestershire | 61.4 | 75.6 | 14.2 |
| 61 | Rushcliffe | Nottinghamshire | 61.4 | 75.6 | 14.2 |
| 62 | Thurrock | Essex | 57.7 | 75.3 | 17.6 |
| 63 | Wigan | Lancashire | 61.6 | 75.3 | 13.7 |
| 64 | Guildford | Surrey | 61.6 | 75.3 | 13.7 |
| 65 | Cheltenham | Gloucestershire | 60.7 | 75.2 | 14.5 |
| 66 | St Albans | Hertfordshire | 60.7 | 75 | 14.3 |
| 67 | Swindon | Wiltshire | 58.4 | 74.9 | 16.5 |
| 68 | Mansfield | Nottinghamshire | 61.7 | 74.9 | 13.2 |
| 69 | East Renfrewshire | East Renfrewshire | 60.3 | 74.6 | 14.3 |
| 70 | Wolverhampton | West Midlands | 60.5 | 74.6 | 14.1 |
| 71 | Elmbridge | Surrey | 60.8 | 74.5 | 13.7 |
| 72 | Reading | Berkshire | 59.5 | 74.4 | 14.9 |
| 73 | Knowsley | Merseyside | 59.9 | 74.4 | 14.5 |
| 74 | Birmingham | West Midlands | 59 | 74.1 | 15.1 |
| 75 | Welwyn Hatfield | Hertfordshire | 60.1 | 73.9 | 13.8 |
| 76 | South Tyneside | Tyne & Wear | 63.7 | 73.9 | 10.2 |
| 77 | Exeter | Devon | 59.1 | 73.8 | 14.7 |
| 78 | Fareham | Hampshire | 61.5 | 73.8 | 12.3 |
| 79 | Epsom and Ewell | Surrey | 58.4 | 73.4 | 15 |
| 80 | Swansea | Swansea | 59.7 | 73.3 | 13.6 |
| 81 | Test Valley | Hampshire | 48.2 | 72.7 | 24.5 |
| 82 | Norwich | Norfolk | 60.3 | 72.5 | 12.2 |
| 83 | Ipswich | Suffolk | 59.5 | 72.3 | 12.8 |
| 84 | Southampton | Hampshire | 56.3 | 72 | 15.7 |
| 85 | Epping Forest | Essex | 65 | 71.9 | 6.9 |
| 86 | Telford and Wrekin | Shropshire | 56.7 | 71.7 | 15 |
| 87 | North Hertfordshire | Hertfordshire | 58.5 | 71.6 | 13.1 |
| 88 | Halton | Cheshire | 57.9 | 71.4 | 13.5 |
| 89 | Stoke-on-Trent | Staffordshire | 59.3 | 71 | 11.7 |
| 90 | Nuneaton and Bedworth | Warwickshire | 59.5 | 71 | 11.5 |
| 91 | Runnymede | Surrey | 56.6 | 70.7 | 14.1 |
| 92 | Liverpool | Merseyside | 56.6 | 70.6 | 14 |
| 93 | Dacorum | Hertfordshire | 57.2 | 70.5 | 13.3 |
| 94 | Bolton | Greater Manchester | 57.9 | 70.4 | 12.5 |
| 95 | Charnwood | Leicestershire | 56.2 | 70.1 | 13.9 |
| 96 | South Lanarkshire | South Lanarkshire | 56.4 | 70.1 | 13.7 |
| 97 | Erewash | Derbyshire | 58.9 | 70.1 | 11.2 |
| 98 | Warrington | Cheshire | 57.1 | 69.8 | 12.7 |
| 99 | Trafford | Greater Manchester | 55.7 | 69.7 | 14 |
| 100 | Kettering | Northamptonshire | 59 | 69.7 | 10.7 |
| 101 | Oadby and Wigston | Leicestershire | 56.4 | 69.6 | 13.2 |
| 102 | West Berkshire | Berkshire | 60.1 | 69.4 | 9.3 |
| 103 | Bracknell Forest | Berkshire | 56.3 | 69.1 | 12.8 |
| 104 | North West Leicestershire | Leicestershire | 56.7 | 69.1 | 12.4 |
| 105 | Slough | Berkshire | 54 | 68.7 | 14.7 |
| 106 | Newport | Newport | 56.5 | 68.7 | 12.2 |
| 107 | Salford | Greater Manchester | 54.3 | 68.6 | 14.3 |
| 108 | Sefton | Merseyside | 55.4 | 68.6 | 13.2 |
| 109 | Burnley | Lancashire | 56.8 | 68.5 | 11.7 |
| 110 | Aylesbury Vale | Buckinghamshire | 62.3 | 68.2 | 5.9 |
| 111 | Reigate and Banstead | Surrey | 54.6 | 68 | 13.4 |
| 112 | Vale of White Horse | Oxfordshire | 61.6 | 67.9 | 6.3 |
| 113 | East Riding of Yorkshire | East Riding of Yorkshire | 51.4 | 67.8 | 16.4 |
| 114 | Coventry | West Midlands | 52 | 67.8 | 15.8 |
| 115 | Basildon | Essex | 54.4 | 67.8 | 13.4 |
| 116 | Dartford | Kent | 44.1 | 67.7 | 23.6 |
| 117 | Spelthorne | Surrey | 53.4 | 67.6 | 14.2 |
| 118 | Warwick | Warwickshire | 55.1 | 67.5 | 12.4 |
| 119 | Neath Port Talbot | Neath Port Talbot | 55.7 | 67.5 | 11.8 |
| 120 | Gravesham | Kent | 53.5 | 67.2 | 13.7 |
| 121 | East Hertfordshire | Hertfordshire | 53.9 | 67.2 | 13.3 |
| 122 | Blackpool | Lancashire | 53.2 | 66.9 | 13.7 |
| 123 | Central Bedfordshire | Bedfordshire | 53.7 | 66.8 | 13.1 |
| 124 | Oldham | Greater Manchester | 53.9 | 66.8 | 12.9 |
| 125 | Walsall | West Midlands | 52.1 | 66.7 | 14.6 |
| 126 | Wokingham | Berkshire | 55.3 | 66.6 | 11.3 |
| 127 | Stafford | Staffordshire | 53.5 | 66.3 | 12.8 |
| 128 | Blaby | Leicestershire | 47.1 | 66.2 | 19.1 |
| 129 | Preston | Lancashire | 53 | 66.2 | 13.2 |
| 130 | North Tyneside | Tyne & Wear | 54.5 | 65.9 | 11.4 |
| 131 | Sandwell | West Midlands | 52.1 | 65.6 | 13.5 |
| 132 | Leeds | West Yorkshire | 52.4 | 65.6 | 13.2 |
| 133 | Southend-on-Sea | Essex | 53.7 | 65.4 | 11.7 |
| 134 | Gateshead | Tyne & Wear | 54 | 65.4 | 11.4 |
| 135 | Wellingborough | Northamptonshire | 52.8 | 64.8 | 12 |
| 136 | Colchester | Essex | 50.1 | 64.7 | 14.6 |
| 137 | Glasgow | Glasgow | 46.8 | 64.6 | 17.8 |
| 138 | Hinckley and Bosworth | Leicestershire | 52.6 | 64.6 | 12 |
| 139 | South Cambridgeshire | Cambridgeshire | 52.5 | 64.2 | 11.7 |
| 140 | South Ribble | Lancashire | 53.2 | 64.2 | 11 |
| 141 | Newcastle-under-Lyme | Staffordshire | 51.1 | 63.9 | 12.8 |
| 142 | Craven | North Yorkshire | 48.6 | 63 | 14.4 |
| 143 | Bradford | West Yorkshire | 51.2 | 62.9 | 11.7 |
| 144 | Lichfield | Staffordshire | 50.1 | 62.5 | 12.4 |
| 145 | Blackburn with Darwen | Lancashire | 49.7 | 62.3 | 12.6 |
| 146 | East Northamptonshire | Northamptonshire | 50.7 | 62.2 | 11.5 |
| 147 | Rugby | Warwickshire | 50.6 | 62 | 11.4 |
| 148 | Tonbridge and Malling | Kent | 49.6 | 61.4 | 11.8 |
| 149 | Newcastle upon Tyne | Tyne & Wear | 49.8 | 61.2 | 11.4 |
| 150 | West Lothian | West Lothian | 45.9 | 61.1 | 15.2 |
| 151 | Maidstone | Kent | 49.1 | 61.1 | 12 |
| 152 | Lisburn and Castlereagh | Lisburn and Castlereagh | 49.1 | 60.9 | 11.8 |
| 153 | Basingstoke and Deane | Hampshire | 47 | 60.8 | 13.8 |
| 154 | Mole Valley | Surrey | 49.4 | 60.8 | 11.4 |
| 155 | Derry and Strabane | Derry and Strabane | 46.3 | 60.7 | 14.4 |
| 156 | Kirklees | West Yorkshire | 48.8 | 60.7 | 11.9 |
| 157 | North Lincolnshire | Lincolnshire | 49.8 | 60.7 | 10.9 |
| 158 | Tewkesbury | Gloucestershire | 47 | 60.6 | 13.6 |
| 159 | Hyndburn | Lancashire | 49.1 | 60.6 | 11.5 |
| 160 | Antrim and Newtownabbey | Antrim and Newtownabbey | 47.5 | 60.4 | 12.9 |
| 161 | Wirral | Merseyside | 48.3 | 60.3 | 12 |
| 162 | Harrogate | North Yorkshire | 48.7 | 60.2 | 11.5 |
| 163 | Vale of Glamorgan | Vale of Glamorgan | 48.9 | 60.1 | 11.2 |
| 164 | South Lakeland | Cumbria | 42.7 | 59.9 | 17.2 |
| 165 | Newark and Sherwood | Nottinghamshire | 48.6 | 59.9 | 11.3 |
| 166 | Sunderland | Tyne & Wear | 49.5 | 59.9 | 10.4 |
| 167 | Huntingdonshire | Cambridgeshire | 49.6 | 59.8 | 10.2 |
| 168 | Ards and North Down | Ards and North Down | 37 | 59.7 | 22.7 |
| 169 | Eastleigh | Hampshire | 48.4 | 59.7 | 11.3 |
| 170 | Manchester | Greater Manchester | 45.8 | 59.6 | 13.8 |
| 171 | Great Yarmouth | Norfolk | 47.3 | 59.6 | 12.3 |
| 172 | Rochdale | Greater Manchester | 46.7 | 59.5 | 12.8 |
| 173 | Wyre Forest | Worcestershire | 47.4 | 59.4 | 12 |
| 174 | Ashford | Kent | 45.9 | 58.7 | 12.8 |
| 175 | Chorley | Lancashire | 48.4 | 58.1 | 9.7 |
| 176 | North Kesteven | Lincolnshire | 47.2 | 57.9 | 10.7 |
| 177 | Melton | Leicestershire | 48.2 | 57.8 | 9.6 |
| 178 | Castle Point | Essex | 46.1 | 57.7 | 11.6 |
| 179 | Windsor and Maidenhead | Berkshire | 46.4 | 57.3 | 10.9 |
| 180 | West Oxfordshire | Oxfordshire | 44.7 | 57.1 | 12.4 |
| 181 | Chiltern | Buckinghamshire | 47.7 | 57.1 | 9.4 |
| 182 | Cherwell | Oxfordshire | 48 | 56.6 | 8.6 |
| 183 | Fife | Fife | 43.4 | 56.5 | 13.1 |
| 184 | Rotherham | South Yorkshire | 43.8 | 56.3 | 12.5 |
| 185 | Chelmsford | Essex | 44.9 | 56.3 | 11.4 |
| 186 | Tandridge | Surrey | 45 | 56.2 | 11.2 |
| 187 | York | North Yorkshire | 44 | 56.1 | 12.1 |
| 188 | Tameside | Greater Manchester | 43.5 | 55.8 | 12.3 |
| 189 | Rutland | Rutland | 40.8 | 54.9 | 14.1 |
| 190 | Bury | Lancashire | 43.8 | 54.9 | 11.1 |
| 191 | Bath and North East Somerset | Somerset | 41.5 | 54.8 | 13.3 |
| 192 | Winchester | Hampshire | 41.9 | 54.4 | 12.5 |
| 193 | Swale | Kent | 44.1 | 54.4 | 10.3 |
| 194 | South Oxfordshire | Oxfordshire | 47.6 | 53.6 | 6 |
| 195 | Wiltshire | Wiltshire | 56.1 | 53.6 | -2.5 |
| 196 | Pendle | Lancashire | 43.8 | 53.3 | 9.5 |
| 197 | Fenland | Cambridgeshire | 38.3 | 53.1 | 14.8 |
| 198 | Dover | Dover | 39.4 | 53.1 | 13.7 |
| 199 | Bromsgrove | Worcestershire | 40.3 | 52.6 | 12.3 |
| 200 | South Ayrshire | South Ayrshire | 40.4 | 52.5 | 12.1 |
| 201 | Folkestone & Hythe | Kent | 58.6 | 52.3 | -6.3 |
| 202 | Torbay | Devon | 40.2 | 52.2 | 12 |
| 203 | Torfaen | Torfaen | 40.7 | 52 | 11.3 |
| 204 | Broadland | Norfolk | 41.6 | 52 | 10.4 |
| 205 | Tunbridge Wells | Kent | 41.7 | 52 | 10.3 |
| 206 | Barnsley | South Yorkshire | 41.3 | 51.9 | 10.6 |
| 207 | Doncaster | South Yorkshire | 39.7 | 51.1 | 11.4 |
| 208 | Sheffield | South Yorkshire | 43 | 51.1 | 8.1 |
| 209 | Harborough | Leicestershire | 40.5 | 50.9 | 10.4 |
| 210 | South Bucks | Buckinghamshire | 38.7 | 50.7 | 12 |
| 211 | East Cambridgeshire | Cambridgeshire | 40.9 | 50.4 | 9.5 |
| 212 | Perth and Kinross | Perth and Kinross | 41.1 | 50.4 | 9.3 |
| 213 | South Kesteven | Lincolnshire | 42.6 | 50.4 | 7.8 |
| 214 | Rossendale | Lancashire | 42.1 | 50.3 | 8.2 |
| 215 | Wakefield | West Yorkshire | 39.1 | 50.1 | 11 |
| 216 | Sevenoaks | Kent | 46 | 49.8 | 3.8 |
| 217 | East Hampshire | Hampshire | 39.6 | 49.7 | 10.1 |
| 218 | Calderdale | West Yorkshire | 39.9 | 49.7 | 9.8 |
| 219 | South Derbyshire | Derbyshire | 36.1 | 49.6 | 13.5 |
| 220 | Carlisle | Cumbria | 38.5 | 49.6 | 11.1 |
| 221 | Wycombe | Buckinghamshire | 39 | 49.2 | 10.2 |
| 222 | Cheshire East | Cheshire | 40.3 | 49.1 | 8.8 |
| 223 | East Ayrshire | East Ayrshire | 38.1 | 48.4 | 10.3 |
| 224 | Cannock Chase | Staffordshire | 38.7 | 47.7 | 9 |
| 225 | North Somerset | Somerset | 37.9 | 47.2 | 9.3 |
| 226 | Milton Keynes | Buckinghamshire | 33.9 | 46.9 | 13 |
| 227 | North Warwickshire | Warwickshire | 35.4 | 46.9 | 11.5 |
| 228 | South Northamptonshire | Northamptonshire | 35.5 | 46.8 | 11.3 |
| 229 | Chesterfield | Derbyshire | 37.7 | 46.7 | 9 |
| 230 | Thanet | Kent | 30.1 | 46.5 | 16.4 |
| 231 | Staffordshire Moorlands | Staffordshire | 38.1 | 46.5 | 8.4 |
| 232 | Bolsover | Derbyshire | 38.6 | 46.5 | 7.9 |
| 233 | Teignbridge | Devon | 37.5 | 46.3 | 8.8 |
| 234 | Uttlesford | Essex | 33.5 | 46.2 | 12.7 |
| 235 | Stratford-on-Avon | Warwickshire | 36.9 | 46.1 | 9.2 |
| 236 | Daventry | Northamptonshire | 60.8 | 46.1 | -14.7 |
| 237 | Fylde | Lancashire | 37.2 | 45.8 | 8.6 |
| 238 | East Devon | Devon | 31.9 | 45 | 13.1 |
| 239 | Isles of Scilly | Isles of Scilly | 38.1 | 44.8 | 6.7 |
| 240 | Cheshire West and Chester | Cheshire | 36.6 | 44.7 | 8.1 |
| 241 | South Staffordshire | Staffordshire | 30.6 | 44.5 | 13.9 |
| 242 | North Ayrshire | North Ayrshire | 33.6 | 44.5 | 10.9 |
| 243 | West Lindsey | Lincolnshire | 36.9 | 44.5 | 7.6 |
| 244 | Waverley | Surrey | 37.3 | 44.4 | 7.1 |
| 245 | Midlothian | Midlothian | 28.2 | 44.2 | 16 |
| 246 | Causeway Coast and Glens | Causeway Coast and Glens | 34.7 | 43.8 | 9.1 |
| 247 | West Somerset | Somerset | 28.4 | 43.7 | 15.3 |
| 248 | Mid Sussex | West Sussex | 33.9 | 43.4 | 9.5 |
| 249 | Worcester | Worcestershire | 34.7 | 43.4 | 8.7 |
| 250 | Rhondda Cynon Taf | Rhondda Cynon Taf | 33.9 | 43.2 | 9.3 |
| 251 | Wrexham | Wrexham | 30.3 | 43.1 | 12.8 |
| 252 | Mid and East Antrim | Mid and East Antrim | 33 | 42.9 | 9.9 |
| 253 | Bassetlaw | Nottinghamshire | 33.5 | 42.5 | 9 |
| 254 | New Forest | Hampshire | 33.5 | 42.4 | 8.9 |
| 255 | Sedgemoor | Somerset | 30.1 | 42.2 | 12.1 |
| 256 | Stroud | Gloucestershire | 37.2 | 42 | 4.8 |
| 257 | Amber Valley | Derbyshire | 29.6 | 41.9 | 12.3 |
| 258 | Horsham | West Sussex | 33.4 | 41.9 | 8.5 |
| 259 | Mendip | Somerset | 34.7 | 41.9 | 7.2 |
| 260 | Armagh City, Banbridge and Craigavon | Armagh City, Banbridge and Craigavon | 32.5 | 41.8 | 9.3 |
| 261 | Lewes | East Sussex | 30.4 | 41.7 | 11.3 |
| 262 | Angus | Angus | 33.5 | 41.4 | 7.9 |
| 263 | Rochford | Essex | 30.7 | 41.3 | 10.6 |
| 264 | Copeland | Cumbria | 31 | 41.1 | 10.1 |
| 265 | Ribble Valley | Lancashire | 31.7 | 41.1 | 9.4 |
| 266 | East Staffordshire | Staffordshire | 31.3 | 40.5 | 9.2 |
| 267 | Hambleton | North Yorkshire | 32.8 | 40.5 | 7.7 |
| 268 | South Norfolk | Norfolk | 30.2 | 40.2 | 10 |
| 269 | Bridgend | Bridgend | 30.8 | 40.2 | 9.4 |
| 270 | East Lindsey | Lincolnshire | 31.1 | 40.1 | 9 |
| 271 | Caerphilly | Caerphilly | 30.4 | 39.9 | 9.5 |
| 272 | Brentwood | Essex | 31.6 | 39.9 | 8.3 |
| 273 | Wychavon | Worcestershire | 32.1 | 39.9 | 7.8 |
| 274 | Barrow-in-Furness | Cumbria | 33.2 | 39.7 | 6.5 |
| 275 | Chichester | West Sussex | 30 | 39.4 | 9.4 |
| 276 | West Lancashire | Lancashire | 29.6 | 39.3 | 9.7 |
| 277 | Eastbourne | East Sussex | 32 | 39.1 | 7.1 |
| 278 | South Hams | Devon | 29.8 | 38.9 | 9.1 |
| 279 | Babergh | Suffolk | 46.3 | 38.8 | -7.5 |
| 280 | County Durham | County Durham | 30.8 | 38.5 | 7.7 |
| 281 | Newry, Mourne and Down | Newry, Mourne and Down | 32.2 | 38.5 | 6.3 |
| 282 | Merthyr Tydfil | Merthyr Tydfil | 29.1 | 38.4 | 9.3 |
| 283 | Pembrokeshire | Pembrokeshire | 30.9 | 38.4 | 7.5 |
| 284 | Conwy | Conwy | 29.9 | 38.2 | 8.3 |
| 285 | Shropshire | Shropshire | 30 | 37.8 | 7.8 |
| 286 | Braintree | Essex | 29.6 | 37.7 | 8.1 |
| 287 | Wealden | East Sussex | 31.1 | 37.7 | 6.6 |
| 288 | Flintshire | Flintshire | 30.5 | 37.6 | 7.1 |
| 289 | Ryedale | North Yorkshire | 31.4 | 37.4 | 6 |
| 290 | Mid Ulster | Mid Ulster | 32 | 37.3 | 5.3 |
| 291 | Allerdale | Cumbria | 29.6 | 37 | 7.4 |
| 292 | Arun | West Sussex | 29.8 | 37 | 7.2 |
| 293 | Clackmannanshire | Clackmannanshire | 30.3 | 37 | 6.7 |
| 294 | Wyre | Lancashire | 30.4 | 37 | 6.6 |
| 295 | North East Derbyshire | Derbyshire | 29.2 | 36.9 | 7.7 |
| 296 | Herefordshire | Herefordshire | 29.2 | 36.9 | 7.7 |
| 297 | King’s Lynn and West Norfolk | Norfolk | 29.6 | 36.9 | 7.3 |
| 298 | Fermanagh and Omagh | Fermanagh and Omagh | 29.9 | 36.9 | 7 |
| 299 | Na h-Eileanan Siar | Na h-Eileanan Siar | 29.4 | 36.8 | 7.4 |
| 300 | Northumberland | Northumberland | 30 | 36.8 | 6.8 |
| 301 | North Devon | Devon | 30.3 | 36.8 | 6.5 |
| 302 | Maldon | Essex | 28 | 36.7 | 8.7 |
| 303 | Selby | North Yorkshire | 30.1 | 36.7 | 6.6 |
| 304 | Mid Suffolk | Suffolk | 27.9 | 36.6 | 8.7 |
| 305 | Rother | East Sussex | 29.9 | 36.6 | 6.7 |
| 306 | Isle of Wight | Isle of Wight | 30.4 | 36.6 | 6.2 |
| 307 | Scarborough | North Yorkshire | 31 | 36.6 | 5.6 |
| 308 | Hastings | East Sussex | 30.2 | 36.5 | 6.3 |
| 309 | Breckland | Norfolk | 28.9 | 36.3 | 7.4 |
| 310 | Aberdeen | Aberdeen | 29.2 | 36.2 | 7 |
| 311 | Denbighshire | Denbighshire | 28.8 | 36 | 7.2 |
| 312 | South Somerset | Somerset | 29.5 | 36 | 6.5 |
| 313 | North Norfolk | Norfolk | 28.7 | 35.9 | 7.2 |
| 314 | Isle of Anglesey | Isle of Anglesey | 29.4 | 35.9 | 6.5 |
| 315 | Monmouthshire | Monmouthshire | 28.5 | 35.8 | 7.3 |
| 316 | Eden | Cumbria | 28.7 | 35.8 | 7.1 |
| 317 | Boston | Leicestershire | 29.4 | 35.7 | 6.3 |
| 318 | Carmarthenshire | Carmarthenshire | 27.3 | 35.5 | 8.2 |
| 319 | Malvern Hills | Worcestershire | 28.3 | 35.5 | 7.2 |
| 320 | High Peak | Derbyshire | 29 | 35.5 | 6.5 |
| 321 | Tendring | Essex | 27.9 | 35.4 | 7.5 |
| 322 | Stirling | Stirling | 28.3 | 35.4 | 7.1 |
| 323 | Canterbury | Kent | 29.1 | 35.3 | 6.2 |
| 324 | Blaenau Gwent | Blaenau Gwent | 28.9 | 35.1 | 6.2 |
| 325 | Scottish Borders | Scottish Borders | 27.9 | 35 | 7.1 |
| 326 | Moray | Moray | 28 | 35 | 7 |
| 327 | Richmondshire | North Yorkshire | 28.9 | 35 | 6.1 |
| 328 | Torridge | Devon | 28.1 | 34.7 | 6.6 |
| 329 | Gwynedd | Gwynedd | 28.9 | 34.6 | 5.7 |
| 330 | Aberdeenshire | Aberdeenshire | 27.6 | 34.4 | 6.8 |
| 331 | South Holland | Lincolnshire | 28.2 | 34.4 | 6.2 |
| 332 | Argyll and Bute | Argyll and Bute | 26.7 | 34.3 | 7.6 |
| 333 | Derbyshire Dales | Derbyshire | 27.1 | 34.2 | 7.1 |
| 334 | Dumfries and Galloway | Dumfries and Galloway | 27.1 | 34.1 | 7 |
| 335 | East Lothian | East Lothian | 27.2 | 34.1 | 6.9 |
| 336 | Shetland Islands | Shetland Islands | 26.3 | 33.6 | 7.3 |
| 337 | Highland | Highland | 26.9 | 33.6 | 6.7 |
| 338 | West Devon | Devon | 26.6 | 32.7 | 6.1 |
| 339 | Cornwall | Cornwall | 27.6 | 32.7 | 5.1 |
| 340 | Mid Devon | Devon | 30.9 | 31.9 | 1 |
| 341 | Powys | Powys | 24.5 | 31.5 | 7 |
| 342 | Ceredigion | Ceredigion | 25.5 | 31.5 | 6 |
| 343 | Forest of Dean | Gloucestershire | 25 | 30.9 | 5.9 |
| 344 | Orkney Islands | Orkney Islands | 22.7 | 28.7 | 6 |


Mark is a professional technology writer, IT consultant and computer engineer from Dorset (England), he also founded ISPreview in 1999 and enjoys analysing the latest telecoms and broadband developments. Find me on X (Twitter), Mastodon, Facebook, BlueSky, Threads.net and Linkedin.


« ISP Plusnet to Replace Pre-Paid Line Rental Saver Discount UPDATE
Smishing – UK Mobile Firms Unite to Stop COVID-19 Text SCAMS »


Anyone knows how Daventry decreased by 14.7?
Assuming its not simply a mistake,possibly because Ofcom changed the basis on which they calculate premises
T
heir use of mean average speed rather than median doesnt help either, but probably couldnt cause that sort of change
Geographically Daventry has a couple of tiny pockets of FTTP/Virgin availability in a large coverage area.
I presume a good take-up FTTP/Virgin for those areas have put the average up and now most new connections won’t be in those areas and are dragging the average back down.
No surprise to see the Forest of Dean in 343rd place. I expect Orkney to overtake FoD in the next ranking.
However, I expect Fastershire and Gigaclear will still win more awards for their amazing progress.
I assume that Ofcom used data from around mid 2019, following the pattern in its previous reports? If so, some people with time on their hands have published a table based on data that is around ten months old in order to generate a press release, perhaps not the best use of their talents!
And let’s not forget that this data gives a view on average speeds achieved and shed’s no light on what is actually available should people want to invest a little more to improve performance. So it’s both out of date and not especially insightful either.
Excellent points, I couldnt agree more!
Interesting to see an increase of only 1Mb average for mid-devon, confirming the total lack of delivery on schemes over that period by CDS and validating a total lack of progress overall for rural areas, where as those who already have a high averages seeing the largest gains
Odd that Cornwall is 339th given all the EU money that went to installing FTTP.
Not odd at all for Cornwall when you look at what people are buying i.e. even when FTTP available the entry level package dominates i.e. 40/10 and 55/10
Its worth spending some time looking at https://labs.thinkbroadband.com/local/cornwall,E06000052 and the speed test results this shows product split seen and average speeds for those products. Probably should one day write a 300 page document on all the observations you can draw from the data.
Those with much higher speeds tend to be those with virgin media or where fttp has an entry level speed of 100 Mbps or higher
That’s the problem of having an expensive product in a poor county.
Andrew
Do you have any breakdown of which speed package those using FTTP have taken?
Thank you for publishing the figures
Average download speeds are useful, while not giving a true picture as this is pretty well impossible to achieve as OR etc don’t release all their figure.
It highlights the pretty poor state of affairs in my locality, in the > 300 group.
I live in Moray and get 80/20 and have done for the past 4 years so can’t see why Moray is showing so low.
You may be able to get that speed but not everyone can
https://labs.thinkbroadband.com/local/S12000020
87.7% superfast coverage and even if everyone bought the fastest product available to them mean average would be 70 Mbps.
West Dunbartonshire has better coverage and lots of ultrafast too, so best case mean is 451 Mbps
I’m in your area and have had a shade over a 1 M connection ever since adsl first went live. Its people like me with the worst connections that skew the results, along with people who can upgrade but dont.
Averages are generally pointless in comparisons.
I’d be interested in what type of average was used for the table. Based on personal experience the figures for the average in the area in which I live seem high – but that maybe that I only get to see other peoples connection speeds when they are already having problems!
Unfortunately these figures are rather meaningless, as they cover such a wide area…
I live in Ashford – ranked 174 on this list, and showing average speeds of 58.7.
Ashford is a large borough, a fair chunk of it being in the Weald of Kent, where I live.
Here, my speed is luck to reach 11 Mbps on a fair day with the wind behind me. No fibre here, no Virgin Media as they won’t lay cabling outside of the *town* of Ashford, where I imagine most of the 58.7 has come from. Loads of new housing being built in our smaller town of currently approx 9,000 people. No sustainable services to support the increase – wifi included.