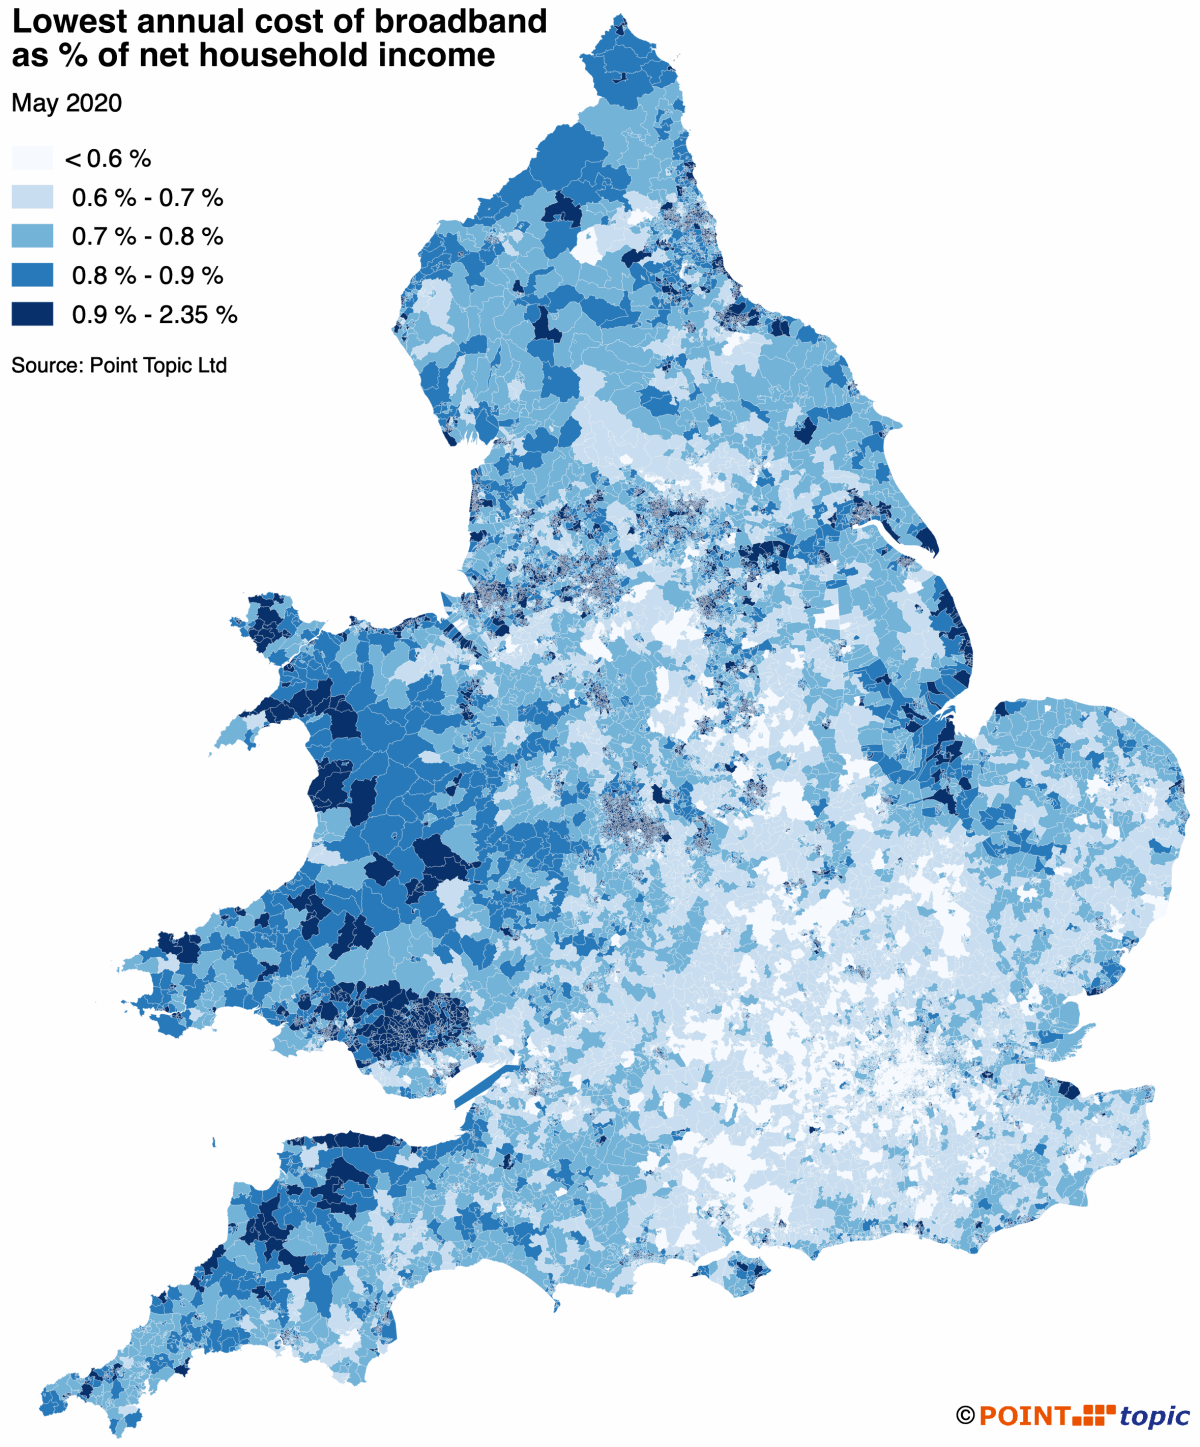
Map of Broadband Affordability vs Income for England and Wales

A new report from Point Topic has examined some of the different measures of broadband ISP affordability across England and Wales (i.e. how much consumers have to pay to get the cheapest broadband available where they live) by factoring in the broader economic context, such as income and deprivation.
Judging something like affordability is incredibly difficult because we all have different levels of financial flexibility. Similarly some people may live in areas where services can be slower, more expensive (often due to a lack of competition) and jobs may pay less. On the flip side others may live in areas where jobs pay more, but the cost of living is higher or maybe you’re not in work at all.
On top of that even a linear comparison of cost between broadband ISPs can be difficult due to the many different service and feature variations. Some packages include a router, but others don’t (the study doesn’t really consider the full impact from things like this). Some packages will give you access to public WiFi hotspots, but others won’t. Gauging the value of all this is tricky and thus somewhat subjective to personal preference.
Advertisement
The aim of Point Topic’s study is broadly to compare how much consumers have to pay to get the cheapest broadband available where they live and how this entry level cost relates to the average household income in that area. In order to do this they looked at different service availability and annual package prices tracked during May 2020 (new customers discounts were included), including phone line rental and setup fees where required.
The study found that the lowest available annual cost of broadband contracts varied from £175.95 in some Lower Layer Super Output Areas (LSOA) to £345.87 in others. Curiously the figure of £175.95 was attributed to Vispa’s ADSL package, which we can’t ever recall being that cheap (it’s been £25.99 per month for awhile = £311.88 for a year) and some of the other ISPs also seem too expensive for what they usually offer (e.g. Vodafone).
However, comparing broadband cost to the household income of a particular area revealed some pronounced differences between parts of the country. Households in the south west, north and east of England, as well as in Wales would typically “spend seven times more” on entry level broadband services in terms of a proportion of their net annual income, compared to the “cheapest” LSOAs (2.35% and 0.33% respectively).
Advertisement
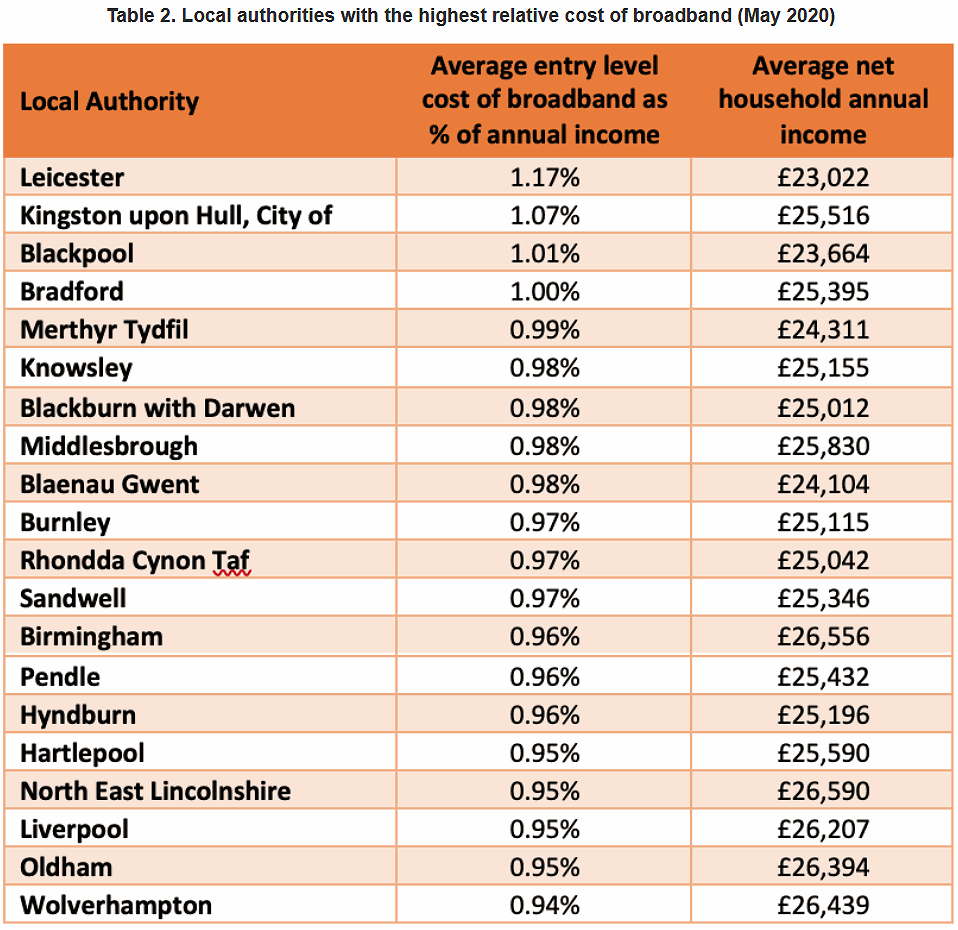
Even within the same region, the differences can sometimes be quite pronounced. For example, in Leicester, which includes an LSOA where households spend the highest proportion of their annual income on the entry level broadband plan (2.35%), this figure was as low as 0.5% in some LSOAs.
At the other end of the spectrum, in the LSOAs of London borough of Islington, this indicator varied from 0.33% (the lowest in England and Wales) to 0.95%. The relative annual cost averaged at the local authority level ranged from 1.17% in Leicester to 0.4% in the City of London.
Overall, at the small area (LSOA) level, the majority of consumers in England and Wales are able to access entry level broadband at a price that Ofcom would consider to be “affordable.” However, doing an accurate gauge for this sort of thing is very difficult and the full report, which goes into a lot more detail, shows quite a bit of variation across England and Wales.
Advertisement


Mark is a professional technology writer, IT consultant and computer engineer from Dorset (England), he also founded ISPreview in 1999 and enjoys analysing the latest telecoms and broadband developments. Find me on X (Twitter), Mastodon, Facebook, BlueSky, Threads.net and Linkedin.


« City of London Corp Giving Out Free 4G Mobile Data and Dongle
Virgin Media UK to Create 98 New Support Staff in Sheffield »


A few areas have FTTH as the cheapest, need details to show why not the adjacent ones? And not B4RN.
Need a TBB analysis.
Point Topic has a share of our coverage data every month.
Remember this the map is a function of broadband price versus income rather than a simple where cheap broadband is available
Why aren’t the lowest cost ones available in most places – see lowest annual cost map.
Not sure what you mean.