UPD Ofcom – Next Gen Broadband Covers 90% of UK as Uptake Tops 30%
The telecoms regulator has today published their annual 2015 Communications Market Report, which reveals the latest details about the take-up and usage of broadband, mobile, phone and broadcasting (TV and Radio) services across the United Kingdom (split by England, Scotland, Wales and N.Ireland).
As usual our focus is more on the fixed line broadband and Internet connectivity front, which thanks to both private and public funding has seen some good improvements. The lion’s share of this effort comes from the big operators, primarily BT’s (Openreach) up to 80Mbps Fibre-to-the-Cabinet (FTTC) platform (with some FTTP) and Virgin Media’s 152Mbps cable (EuroDOCSIS) network.
Advertisement
However it’s unclear how many FTTP/H deployments, if any, Ofcom have included from alternative network operators (e.g. B4RN, Gigaclear, Hyperoptic, IFNL etc.) as they don’t appear to get a firm mention anywhere in the report.
Sharon White, Ofcom’s Chief Executive, said:
“Today’s report shows just how important reliable, fast internet access is to millions of consumers and businesses. Improving the coverage and quality of all communications services across the UK is a priority for Ofcom, for people at work, home or on the move.”
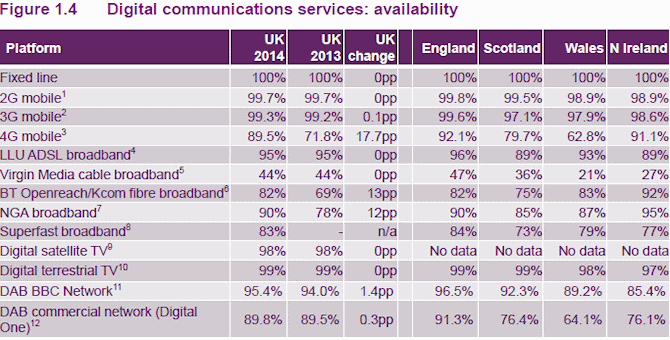
Overall the report confirms that “superfast broadband” (30Mbps+) services are now available to 83% of the UK and take-up has increased to 30% (up from 23.2% last year). Broadly speaking, KC (Hull) and BT’s raw FTTC/P network footprint can now reach 82% of the UK (up from 69%) and Virgin Media is unchanged on 44%.
At this point we should reflect that the Ofcom figure of 90% for Next Generation Access (NGA) broadband coverage, which is up from 78% last year, is higher than the “superfast” figure above because it reflects the raw footprint of related networks, including those areas that receive slower sub-30Mbps speeds.
Elsewhere 4G based Mobile Broadband connectivity, which in some case can deliver better than “superfast” speeds, has also seen a big improvement to reach 89.5% of UK premises (up from 71.8% last year); although EE is responsible for most of this.
Advertisement
The goal is of course to push 4G out to 98% of the population by 2017 (the same as 2G), yet most operators expect to achieve this far sooner and we must not forget how that will still leave 2% (around half a million premises) without a signal. Overall there are now 23.6 million 4G subscriptions in the UK (28% of the total).
The report also found that fixed line broadband connections were reported in 78% of households in 2015 (up from 73% in 2014) and accessing the Internet through a mobile phone continues to increase, rising from 57% in Q1 2014 to 61% in Q1 2015.
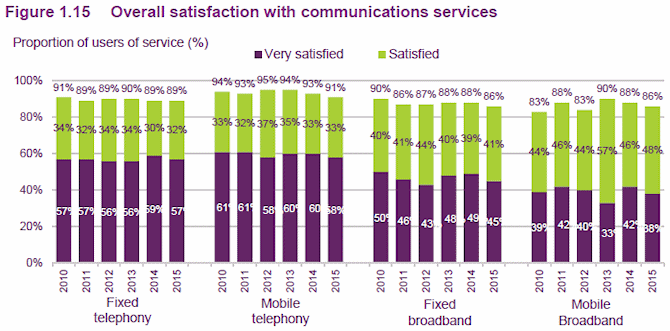
But the proportion of households with fixed telephony and mobile telephony remained stable, at 84% and 95% respectively in 2015. Mind you, consumer satisfaction with fixed broadband has suffered a small fall and it’s not the only one.
Ultimately Ofcom’s report contains around 435 pages and this would be impossible for us to summarise into a single article, so instead here are a few other broadband and telecoms related highlights from the data.
Advertisement
Other Highlights of the Key CMR2015 Points
* The average monthly household spend on communication services (e.g. mobile, broadband and phone lines) has decreased in real terms, from £122.07 in 2009 to £117.71 in 2014. In relation to that the average household spend on fixed Internet services increased by 14.3% to £14.74 per month in 2014, which compares with £44.37 for mobile (down from £45.98 last year) and £22.18 for fixed phone lines (down from £22.52).
* Total telecoms revenues fell by 2% to £37.4bn in 2014, largely as the result of falling wholesale revenue. But fixed internet revenue growth accelerated as a result of increased fibre take-up; retail residential and SME fixed Internet revenues totalled £4.9bn in 2014 (up from £4.2bn in 2013).
* Just under 70% of total time spent watching audio-visual content is still going to traditional (live) television, although Over-The-Top (OTT) Internet streaming services are growing. For example, 16% of UK homes take a subscription to Netflix, while 4% take Amazon Instant and 2% go with Sky’s NOW TV.
* Outgoing landline call volumes fell by an average of 12.5% a year between 2004 and 2014, including narrowband internet call volumes, and by 7.1% a year when these are excluded.
* Internet users aged 16 and above spent 9 hours and 54 minutes online each week in 2005, which has climbed to over 20 hours and 30 minutes in 2014.
* Some 64% of online adults agree that being online is invaluable for keeping them informed about current issues and 60% agree that it helps keep them in touch with close family and friends.
Generally the availability and uptake for fixed line superfast broadband should grow over the next few years as the Government’s Broadband Delivery UK programme continues to work with BT and other ISPs to push the total coverage out to 95% by 2017/18.
However it should be noted that the Government defines “superfast” as download speeds of “greater than 24 Megabits per second“, while Ofcom has chosen to align with the EU’s 2020 target and pegs the figure at 30Mbps; the resultant coverage difference is not thought to be significant, but it can become confusing.
Most of the other data in Ofcom’s report (e.g. fixed line broadband and mobile data speeds) merely appears to regurgitate what they’ve already released before and so we won’t go over that again.
Ofcoms CMR 2015 Report
http://stakeholders.ofcom.org.uk/…/cmr15/
UPDATE 9:54am
The Office for National Statistics has separately published their annual Internet Access – Households and Individuals 2015 report, which covers many of the same areas as Ofcom’s. It notes that in Great Britain, 22.5 million households (86%) have Internet access (up from 84% last year) and this equates to around 39.3 million adults (78% of the population) who go online every day, or almost every day.
Obviously that still leaves 14% with no Internet access and it’s noted that 31% of those reported that this was due to a lack of skills, while 14% blamed it on high equipment costs and another 12% said it was the fault of high access costs. However some 53% of the households without Internet access also said that this was because they didn’t need it.
Elsewhere 74% of adults had used the internet “on the go” using a mobile phone, portable computer or handheld device. However almost all adults aged 16 to 24 (96%) accessed the internet “on the go“, compared with only 29% of those aged 65 years and over.
The most common type of device used to access the internet “on the go” was a mobile phone or smartphone (66%), which is followed by portable computers, such as a laptop or tablet (45%).
Mark is a professional technology writer, IT consultant and computer engineer from Dorset (England), he also founded ISPreview in 1999 and enjoys analysing the latest telecoms and broadband developments. Find me on X (Twitter), Mastodon, Facebook, BlueSky, Threads.net and Linkedin.
« Suffolk Confirm GBP3.9M Reinvestment Boost for Superfast Broadband








Comments are closed