The Bottom and Top 30 UK Constituencies for Superfast Broadband Cover
A snippet of new analysis has revealed both the weak spots and strengths of the current Government’s on-going Broadband Delivery UK programme with BT to make fixed line superfast broadband speeds available to 95% of the United Kingdom by 2017.
The good news, which comes via way of data from Thinkbroadband, is that there are already plenty of constituencies where more than 95% can access “superfast” speeds of 30Mbps+, which is actually better than the Government’s definition of “greater than 24 Megabits per second” (note: BDUK anticipates that future tweaks will also enable 24Mbps+ areas to hit 30Mbps+).
Advertisement
A useful tweak to the results for the top 30 constituencies this time around is that they have been colour coded to the political parties, which means that areas with more Blue are controlled by the Conservatives, while Red is for Labour, Orange for the Liberal Democrats and we assume Green for the Green Party (this may also be used for Plaid Cymru in Wales?). Obviously this colour coding may change after the imminent 2015 general and local elections.

At this point it’s important to reflect that most of the work so far has actually been achieved (i.e the first 70% or so of “superfast” coverage) through the commercial efforts of big operators like BT (FTTC/P) and Virgin Media (EuroDOCSIS cable), with a number of smaller alternative network operators (e.g. KC, B4RN, Hyperoptic etc.) also helping around the edges.
Meanwhile the BDUK programme with BT has tended to focus on roughly the last 30% of commercially unviable areas, which has so far pushed overall superfast broadband coverage to around 80% of the UK. The first goal for BDUK is currently to push superfast coverage to 90% by early 2016 and the progress suggests that it’s working on-target.
Advertisement
As such it’s no surprise to find that there are already plenty of locations, many of which are understandably quite urban and city-centric, that benefit from near total superfast broadband availability (see above). But equally there are many areas in that final 20% that have yet to benefit and these are highlighted by constituency below.
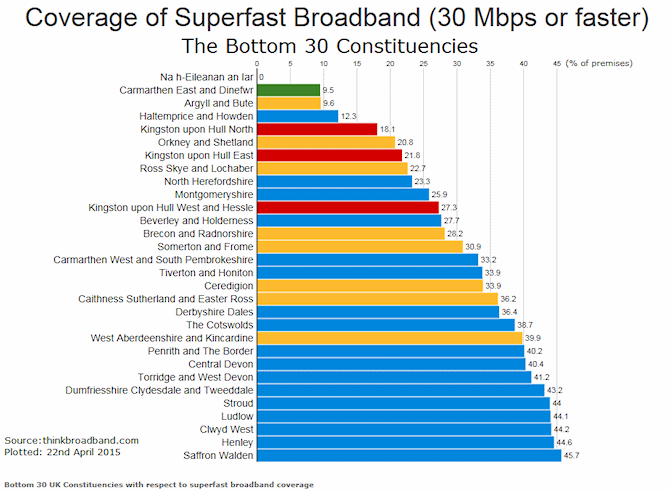
As you’d expect the list contains a fair few rural areas, although a good number of the locations will see an improvement as the BDUK programme expands out towards its 95% coverage goal for 2017/18 and possibly beyond (depending upon what the next Government decides to do).
Take note that the above tables only reflect estimates for fixed line superfast broadband coverage and thus do not factor actual speedtest data (this wouldn’t reflect service availability anyway, only uptake influence) or the performance of Mobile Broadband and Fixed Wireless ISPs that may exist in some of the same locations.
Advertisement
The exclusion of mobile and wireless is a bit disappointing, especially as some of the slower areas may still be able to get superfast speeds via such connection methods, but then the Government’s BDUK based “superfast” target tends to also reflect fixed line connectivity and so these are still very useful tables. But do remember that estimated performance won’t always match reality, although it’s usually a good gauge.
Mark is a professional technology writer, IT consultant and computer engineer from Dorset (England), he also founded ISPreview in 1999 and enjoys analysing the latest telecoms and broadband developments. Find me on X (Twitter), Mastodon, Facebook, BlueSky, Threads.net and Linkedin.
« UK ISP PlusNet Offers 6 Months FREE Unlimited “Fibre Broadband”














Comments are closed