Ofcom – UK Superfast Broadband Uptake Hits 37% as 4G Cover Nears 98%
The national telecoms regulator has released their 2016 Communications Market Report (CMR), which reveals the latest information about the take-up and usage of Broadband, Mobile, Phone, TV and Radio services across the United Kingdom (split by England, Scotland, Wales and N.Ireland).
The full report is huge and as such we’ll stick to focusing upon the fixed line broadband and Internet connectivity front, including mobile networks (3G and 4G). Unfortunately on this point it’s vital to note that some key fixed line data (e.g. NGA broadband coverage and average monthly data usage) have not been updated since last year’s 2015 Connected Nations report.
Advertisement
Apparently the reason for this is because Ofcom has begun collecting data on a premise by premise basis instead of at a postcode level, which we’re told has added “significant” time to their data checking and quality control processes. As such an update to some of the most interesting data points will not follow until September or October at the earliest.
Otherwise the report reveals that take-up of “superfast broadband” (30Mbps+) services has increased to 37.1% (up from 30% last year), which equates to around 9.2 million fixed broadband connections. Most of that uptake comes from Openreach’s (BT) FTTC network and Virgin Media’s cable DOCSIS platform. Total fixed broadband connections also increased by 0.9 million (3.9%) to 24.7 million in 2015.

On top of that it’s good to see that newer 4G (LTE) based Mobile Broadband networks have improved their outdoor coverage to reach 97.8% of the UK premises (up from 89.5% in 2014) and this should reach 98% of the population before the end of 2017 (example). Sadly we don’t get a figure for geographic coverage, although the aim is to hit 90% by the end of 2017. We’d of course take all of these figures with a pinch of salt because mobile signal quality is notoriously unreliable.
Furthermore 4G accounted for almost half (39.5 million) of all mobile subscriptions (46%). A useful summary of digital communication services and coverage + uptake can be seen below.
Advertisement
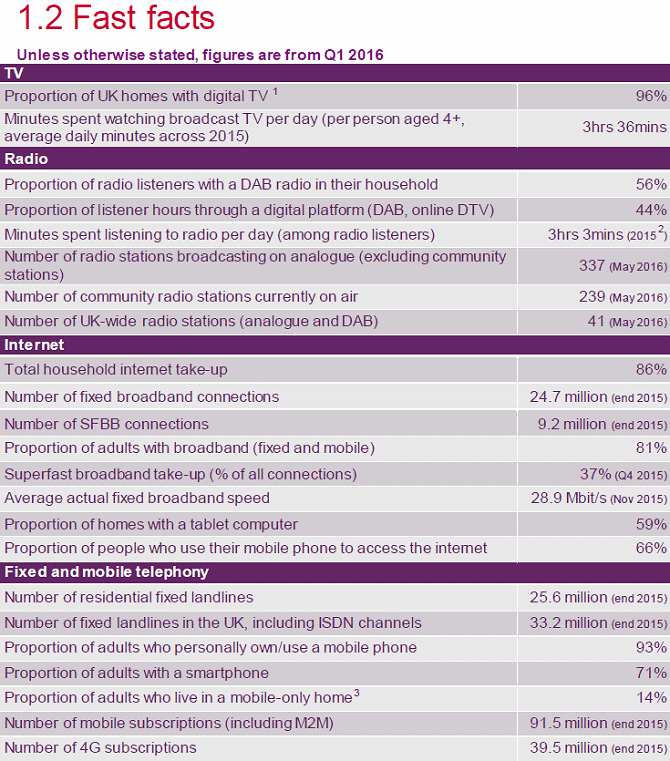
Interestingly the number of homes with landline telephones continued to fall, decreasing by 0.3 million (1.0%) to 33.2 million in 2015 as people shift to mobile services and instant messaging. Despite that some 68% of UK households reported buying at least two of their communications services together in a bundle in 2016, which is up from 63% in 2015.
Dual-Play packages of landline and broadband, and Triple-Play packages of landline, broadband and TV, were the most popular.

In keeping with all of this it might surprise some readers to learn that the average monthly household spend on communication services has actually decreased in real terms over the past five years (i.e. adjusted for inflation) from £121.15 in 2010 to £118.90 in 2015, which seems a little odd given the seemingly endless annual +5-7% hikes in line rental and broadband prices from some major ISPs. Mind you the average monthly price for last year was actually lower at £116.07.
Ofcom also notes that the average monthly household spending on telecoms services (inc. broadband) increased in real terms between 2014 and 2015 by £2.52 (up 3.2%) to £82.17, which was largely as a result of people switching to superfast broadband (this generally attracts a premium of around £10 more per month than standard broadband).
Advertisement

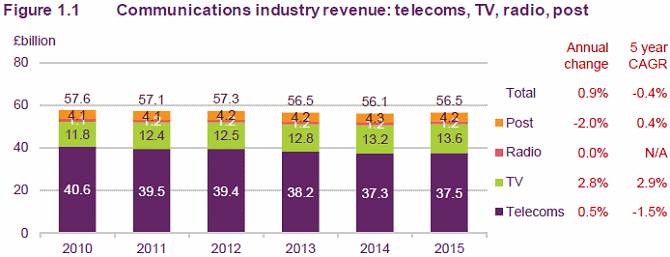
The rising price of broadband and phone services has had other impacts too. Ofcom notes that total UK telecoms revenues grew for the first time in five years – increasing by £0.2bn (0.5%) to £37.5bn between 2014 and 2015. This was mainly due to a £0.5bn increase in retail fixed revenue during the year, which was partially offset by falls in other areas of telecoms revenue.
Overall the total UK communications revenues generated by telecoms, TV, radio and postal services increased in 2015, rising by £0.4bn (0.9%) to £56.5bn, and again that’s mostly due to the boost from telecoms and broadband. The slight rise in the revenue generated by the UK broadcast television industry has also played a part.
Finally, it’s worth noting that the number of respondents claiming to be ‘very’ or ‘fairly’ satisfied with their fixed broadband services has remained mostly stable in 2016, at 87% (up from 86% last year). Similarly the proportion of fixed broadband users who said they were ‘very’ or ‘fairly’ satisfied with the speed of their service also remained stable during this period, at 82% (up from 80% last year).
The situation is similar for residential fixed voice services, where the number of respondents claiming to be ‘very’ or ‘fairly’ satisfied is 88% and that’s down ever so slightly from 89% last year. The story for Mobile networks is almost identical to the above.
Otherwise the only other thing that might be worth a quick mention is that Ofcom are still referencing ultrafast connection speeds as being “above 300Mbps“, which is an idea that they first provisionally suggested last year (others tend to describe “ultrafast” as starting at 100Mbps+) and is perhaps reflective of Virgin’s DOCSIS and BT’s G.fast performance expectations.
The full report is of course packed with masses of other statistics and information, which is frankly very difficult summarise.
Ofcom’s CMR 2016 Report
http://stakeholders.ofcom.org.uk/market-data-research/../cmr16/
UPDATE 9:41am
The Office for National Statistics has separately published their annual Internet Access – Households and Individuals 2016 report, which covers many of the same areas as Ofcom’s study. It notes that in Great Britain, 23.7 million households (89%) have Internet access (up from 86% last year) and this equates to around 41.8 million adults (82% of the adult population) who go online every day, or almost every day.
Obviously that still leaves 11% of households with no Internet access and it’s noted that 21% of those reported that this was due to a lack of skills (down from 31% last year), while 9% blamed it on high equipment costs (down from 14%) and another 9% said it was the fault of high access costs (down from 12%). However some 59% of the households without Internet access also said that this was because they didn’t need it (up from 53%).
Elsewhere 70% of adults had used the Internet “on the go” using a mobile phone or Smartphone device, which is up from 66% last year.
Mark is a professional technology writer, IT consultant and computer engineer from Dorset (England), he also founded ISPreview in 1999 and enjoys analysing the latest telecoms and broadband developments. Find me on X (Twitter), Mastodon, Facebook, BlueSky, Threads.net and Linkedin.
« Aquiss Bring Unlimited Broadband to BT’s Older 20CN UK Exchanges






Comments are closed