EE’s Mobile Network Index Reveals Summer Internet Traffic Trends

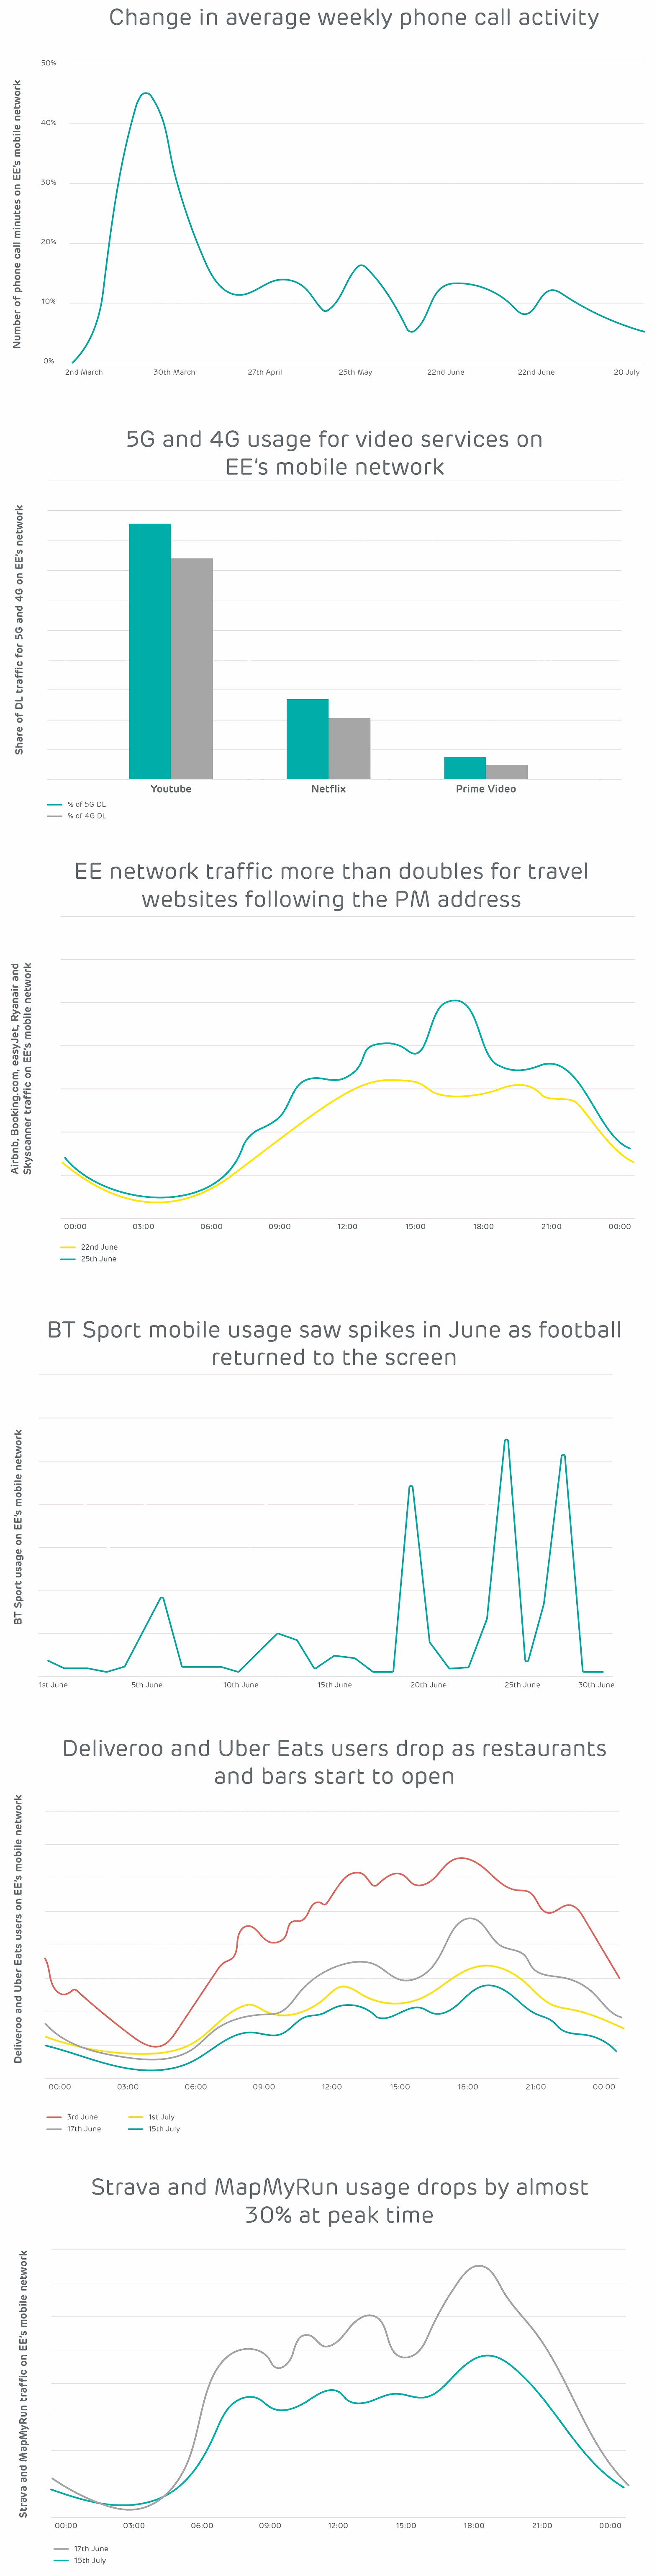
Mobile operator EE (BT) has today published their latest UK Mobile Network Index, which among other things reveals that data traffic (mobile broadband) more than doubled to travel and holiday sites, while voice calls returned to near pre-lockdown levels (i.e. they’ve reduced) and 5G users watch more online video than 4G ones.
As usual most of the changing trends that have been seen over the summer period tend to reflect the impact from the Government’s gradual move to relax the COVID-19 lockdown restrictions. However, we may soon see some of these aspects change again, as tighter rules are re-introduced to tackle the rising second wave of infections.
For example, mobile data traffic to the BT Sport TV app and service saw a noticeable increase in late June 2020 as football matches and other events began to be played again. On the flip side, as restaurants started to re-open and rules relaxed to allow people to visit households outside of their own, the demand for food takeaways decreased.
Advertisement
Similarly, it’s noted that traffic for Strava and MapMyRun decreased by almost 30% at peak usage between June and July, mostly due to a combination of more people returning to work and others going away on holiday. Evenings are once again the most popular time for exercise, with the spike moving later in the evening in July, compared to June.
Marc Allera, CEO of BT’s Consumer Division, said:
“The easing of lockdown has driven notable changes in the ways our customers are using our mobile network. The more than doubling of traffic to sites including Airbnb, Booking.com, easyJet, Ryanair and Skyscanner shows an increase of plans to travel and take breaks. Video remains as popular as ever, with Londoners watching the most content across the UK in the months of June and July, while food takeaway apps have declined in popularity over the same period. What’s clear is that the role of a reliable mobile network continues to be hugely important, and I’m pleased that the EE network continues to deliver a great performance for our customers.”
You can see all of this summarised in the charts below, which somewhat speak for themselves.


Mark is a professional technology writer, IT consultant and computer engineer from Dorset (England), he also founded ISPreview in 1999 and enjoys analysing the latest telecoms and broadband developments. Find me on X (Twitter), Mastodon, Facebook, BlueSky, Threads.net and Linkedin.


« Jurassic Fibre Preps FTTP Broadband for Somerset and Dorset
New UK Smart Data Laws May Help Broadband Deal Comparisons »


Comments are closed