BDUK Publish New Evaluation of UK Superfast Broadband Project

The Government’s Building Digital UK team has today posted a new evaluation of the previous Superfast Broadband Programme (SFBB), which helped to boost the coverage of “superfast” (24-30Mbps+) ISP networks from c.76% (commercial) to around 97% of premises (i.e. an additional 5.5 million premises) across three phases.
Just to recap. The SFBB programme was originally setup back in 2010 to help extend high-speed broadband connectivity to areas that were not expected to benefit from commercial rollouts, although the first contracts and builds didn’t really start until the 2012 – 2013 period.
The programme was split into three phases (see below), awarding a total of 147 contracts across the UK, and remains ongoing today, albeit at a much-reduced rollout pace (most of the major rollout contracts have long since completed). The focus has since turned to the new £5bn Project Gigabit programme, but that’s a different discussion.
Advertisement
The goal was essentially to extend the coverage of 24Mbps+ (later 30Mbps+) capable “superfast broadband” into areas where commercial operators either refused to go, or were unlikely to reach for several more years without some degree of public subsidy (i.e. tackling areas of perceived market failure).
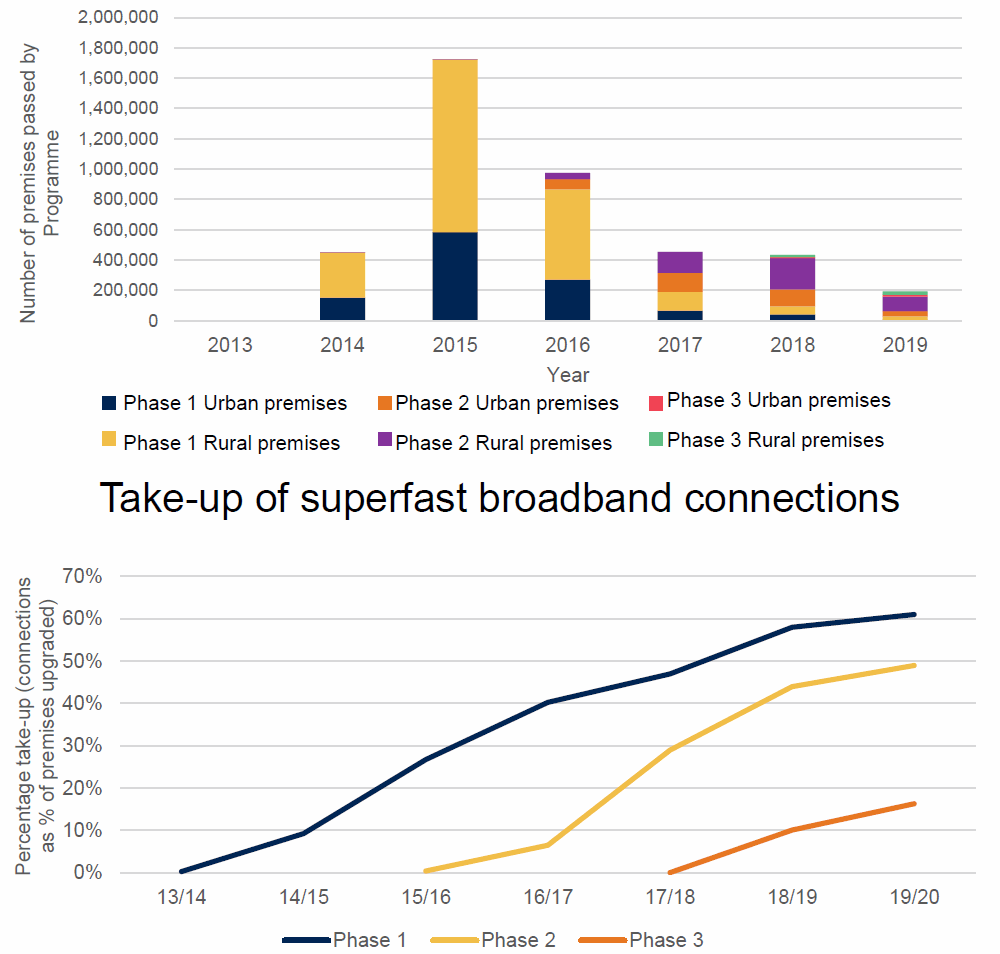
SFBB Phases One (Finished Spring 2016)
Supported by £530m of public money via the Government (mostly extracted from a small slice of the BBC TV Licence fee), as well as significant match funding from local authorities and the EU. The public funding was roughly matched by BT’s private investment. Overall it helped to extend “superfast broadband” (24Mbps+) services to cover 90% of premises in the United Kingdom.
SFBB Phase Two
Supported by £250m of public money via the Government, as well as match funding from local authorities, Local Growth Deals and private investment from suppliers (e.g. BT, Gigaclear, Airband, Call Flow etc.). This phase extended superfast broadband services to 95% of premises in time for the end of 2017.
SFBB Phase Three
Similar to Phase Two, albeit without a solid coverage target, and funded under a new state aid judgement covering contracts awarded between 2016 and 2020 (State aid SA. 40720 (2016/N)). So far, contracts awarded under Phase 3 by mid-2020 have involved £391m in public funding and mostly focused on extending FTTP coverage.
BT (Openreach) scooped up the vast majority of the 147 contracts across the three phases – 85% of them overall and 100% in Phase One, until the approach was changed to engage alternative networks. Take-up by consumers in the Phase One areas has since reached 60-70%, with Phases 2 and 3 following the same sort of trend.
A total of 5.3 million premises had already benefitted from the programme by mid-2020, but BDUK expects this to reach c.5.5 million once the contracts have completed.
Advertisement
The expected total value of funding for the programme was approaching £3 billion in June 2020 (Phase 1 £1.6bn, Phase 2 £676m and Phase 3 £640m), which includes all funding sources, not only public investment directly from the UK government. A total of £1.9bn of public sector funding was committed across all three phases.
This equates to an ex-ante gross public sector cost per premises passed of £342. There was a large degree of variation across the various phases. Phase 1 had the lowest cost per premises passed of £266 because it focused upon somewhat easier areas and was dominated by cheaper hybrid Fibre-to-the-Cabinet (FTTC / VDSL2) technology. Phase 3 had the highest public sector cost per premises at over £1,216 because it focused on the hardest to reach areas and involved significantly more Fibre-to-the-Premises (FTTP), albeit reaching a smaller number of premises than Phase 1.
The measure of take-up (above) is important here because the contracts use it to gauge clawback (gainshare). If take-up proved to be higher than anticipated at the tendering stage, network providers were required to return a share of the excess revenues generated from additional take-up, which local authorities could then use to reinvest into future broadband improvements.
For example, the expected public sector costs per premises upgraded was £342. However, after allowing for clawback, this is expected to fall to just £140 per premises upgraded (this figure also includes underspend by suppliers – where the cost of delivery was lower than expected, which alone would take £342 down to £280). “Even after accounting for the likelihood that a share of the premises upgraded would have received improved broadband connectivity anyway, a net cost per additional premises upgraded of £250 is expected,” said the report.
Advertisement
The true value of clawback will not be known until all of the contracts have been fully wound down 7-years post completion, but the modelling does provide for a useful forecast.
Impact on SFBB Costs
• Underspending: Forecast public spending before clawback is expected to fall from £1.9bn to £1.5bn in nominal terms (£1.7bn in 2019 prices). This difference is largely driven by underspending on Phase 1 contracts. The gross value of the public spending associated with contracts at the point they were awarded was £1.2bn. However, final claims were only made for £689m of public funding.
• Clawback: Network providers are also expected to return £147m to the public sector (in 2019 prices) because delivery costs were overstated. Network providers are also expected to return a further £714m (in 2019 prices) to the public sector due to higher-than-expected take-up. This was largely driven by Phase 1 contracts.
• Net public spending: After accounting for clawback, it was estimated that the net cost of the contracts to the public sector will fall to £807m (in 2019 prices).
Finally, the report also attempts to summarise some of the other positive economic impacts from the SFBB programme.
Economic and Benefits of the SFBB Project
➤ Enhanced broadband coverage was estimated to have increased employment by 0.6 percent, leading to the creation of approximately 17,600 local jobs by the end 2018.
➤ Enhanced coverage also increased the turnover of firms by almost 1.0 percent by 2018, increasing the annual turnover of local businesses by approximately £1.9bn per annum.
➤ Employees working for firms located in the areas benefitting from subsidised coverage saw their hourly earnings increase by 0.7 percent in real terms in response to the upgrade.
➤ At a national level, the Superfast programme is estimated to have resulted in £1.1bn in productivity gains between 2012 and 2019 and led to an increase in house prices of between £1,700 and £3,500 on average and £0.7bn and £1.5bn in total in the beneficiary areas (take that with a pinch of salt as gauging changes in house prices due to faster broadband is highly subjective).
➤ The benefits of the Superfast Programme are expected to significantly exceed its costs. The estimated Benefit to Cost Ratio was between £2.70 and £3.80 per £1 of net public sector spending, based on its impacts between 2012 and 2019. Allowing for future benefits to 2030, the Benefit to Cost Ratio is estimated to rise to between £3.6 and £5.1 per £1 of net public sector spending.
➤ Subsidising network deployment has proven an effective means of accelerating broadband coverage which has significant economic and social benefits. Alternative delivery models are unlikely to have produced outcomes on a similar scale or offered equivalent value for money.
However, the report did call out some well-known problems with the programme. For example, it noted that the Open Market Review (OMR) process, which helps to determine the areas that require public intervention by mapping planned coverage by commercial operators, can easily become outdated when commercial plans expand. The report suggests that “smaller projects of shorter duration” may minimise the risk that OMRs get ‘overtaken’ by external events.
The delivery of Phase 3 contracts was also found to have been delayed, by issues such as insufficient capacity amongst network providers to deliver at the scales required by the contracts awarded, contractual challenges and challenges in the building of the networks (e.g. Gigaclear, but Openreach also suffered some issues). “This is clearly a risk for any future Programme and will need to be considered carefully,” said the report with one eye on Project Gigabit. You can find lots of additional detail in the full report.
Superfast Broadband Programme Evaluation Reports 2021
https://www.gov.uk/..-synthesis-and-process-evaluation-reports-2021


Mark is a professional technology writer, IT consultant and computer engineer from Dorset (England), he also founded ISPreview in 1999 and enjoys analysing the latest telecoms and broadband developments. Find me on X (Twitter), Mastodon, Facebook, BlueSky, Threads.net and Linkedin.


« BDUK Publish Phase 3 of UK Rural Gigabit Broadband Rollout Plan
ISP County Broadband Finally Starts FTTP Rollout in Sudbury »


What a shame some of the clawback wasn’t used to improve the sub superfast current supplied in Dankshire and other places.
Get onto Dankshire local authority about it. They have to actually do something, isn’t going to happen by magic.
I have, and they refused, as did OR, DCMS
In the same boat here.
I live litterally down the road from a fibre/broadband hub yet can get anything.
And i live in neighbourhiod with at least 50 homes and more due to go up over the next 2 years.
2mbs download and 0.3kbs upload, fun times :(.
Hell, theres a big school just down the road and they have stupid fast internet.
What’s the 3G, 4G or 5G like in your area?
I used to live in a similar area and ended up using 3G and used to get 18-24mbps.
Do a Speedtest using the data on your phone and if it’s good then perhaps switch over to a mobile broadband plan.