Streetwave Publish Map of South Yorkshire 4G and 5G Mobile Cover and Data Speed

A few months ago we reported that the South Yorkshire Mayoral Combined Authority (SYMCA) in England and network analyst firm Streetwave had begun a new project to map 4G and 5G mobile broadband coverage and speed across the region using bin lorries (here). The data from this has now been made available to the public via a new interactive map.
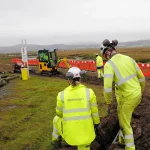
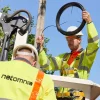
Streetwave has spent the past two years harnessing waste (bin / refuse) collection trucks to map mobile network coverage and speeds in various parts of the UK (e.g. here, here, here, here and here). In this approach, refuse collection trucks are installed with several off-the-shelf Smartphones using special software, which run continuous network tests (once every 20 metres in rural areas and 5m in urban areas) as the vehicles go around.
The data they collect is then used by local authorities to help identify areas that may require additional intervention in order to improve local mobile coverage and or network capacity. In addition, members of the public have also been given access to some of this data via address-based coverage checkers and interactive maps.
Advertisement
The latest region to benefit from this is South Yorkshire, which is home to around 1,400,000 people. The 12-month £34,000 project, which was funded by the SYMCA, now allows residents and businesses to check their coverage at home, on the commute and at work enabling informed network choices, reducing unnecessary spending and lost productivity.
South Yorkshire’s Mayor, Oliver Coppard, said:
“These days getting online and staying connected isn’t a luxury; it’s vital. Whether we’re booking a doctor’s appointment, running a business, or keeping in touch with friends, we all rely on decent mobile signal.
But too many of us in South Yorkshire are still stuck in mobile ‘not spots’, where coverage drops out or disappears completely. That’s just not good enough.
That’s why we’re working together to fix it. Our project gives us the data we need to push for better coverage, so wherever we live, work or travel, we can all get the signal we need. It’s another step towards building a fairer, more connected South Yorkshire that’s fit for the future.”
The interactive map – https://app.streetwave.co/coverage-checker/south-yorkshire – enables people to both get details on download and upload speeds for specific addresses, as well as showing how mobile data performance varies from area to area by different mobile operators. But it should be noted that this study was conducted before the Vodafone and Three UK merger, thus it won’t be able to reflect any recent changes as a result of the shared network integration.


Mark is a professional technology writer, IT consultant and computer engineer from Dorset (England), he also founded ISPreview in 1999 and enjoys analysing the latest telecoms and broadband developments. Find me on X (Twitter), Mastodon, Facebook, BlueSky, Threads.net and Linkedin.


« ISPA Reveal WINNERS of the 2025 UK ISP Internet Industry Awards


I’m sure this is fascinating data but why on earth is a Mayoral authority spending £34,000 on such projects ???
Who would you say should pay towards this?
I think it’s useful to know which networks are bad and where they are bad to then engage with them and make decisions on mast approvals.
It’s harder for them to say “no” to a mast because locals – which have no idea how networks work – insist it’s not needed if they have a survey on their hands saying it’s bad. It also puts the worse councils under pressure because no one wants to be seen as being the worse.
I don’t know if they should pay £34k or not, but considering these are unlikely to be people that go around with their phones tracking masts, signal strength, running speed tests, etc, I can see why such surveys are useful for them.
Many Telecare devices use 2G/4G networks instead of or alongside fixed-line connectivity – Local Authorities have a certain amount of responsibility here.
I dont get why google doesnt map coverage when they do the streetview rounds