Ofcom reveals worst UK local authority areas for mobile broadband performance

The communications and media regulator, Ofcom, has today published their 2026 Mobile Matters report, which uses Opensignal’s crowdsourced data (collected between Aug 2025 and July 2026) to benchmark the performance of UK mobile broadband networks by both technology (2G to 5G), nation and operator choice – including Three UK, O2, Vodafone and EE.
The results, based on over 225 million datapoints, reveal some interesting details. For example, the average 4G performance score (78%) was significantly lower than those for the latest 5G Standalone (5G+) and regular 5G Non-Standalone connections (both 92%). The UK government retains an ambition “for all populated areas” to have access to 5G+ by 2030.
In addition, 4G continued to be the most frequently used mobile technology across the UK, despite continued growth in the availability of 5G. In figures, 4G accounted for 75% of data connection attempts in England and in Northern Ireland, albeit rising to 78% in Scotland and 82% in Wales.
Advertisement
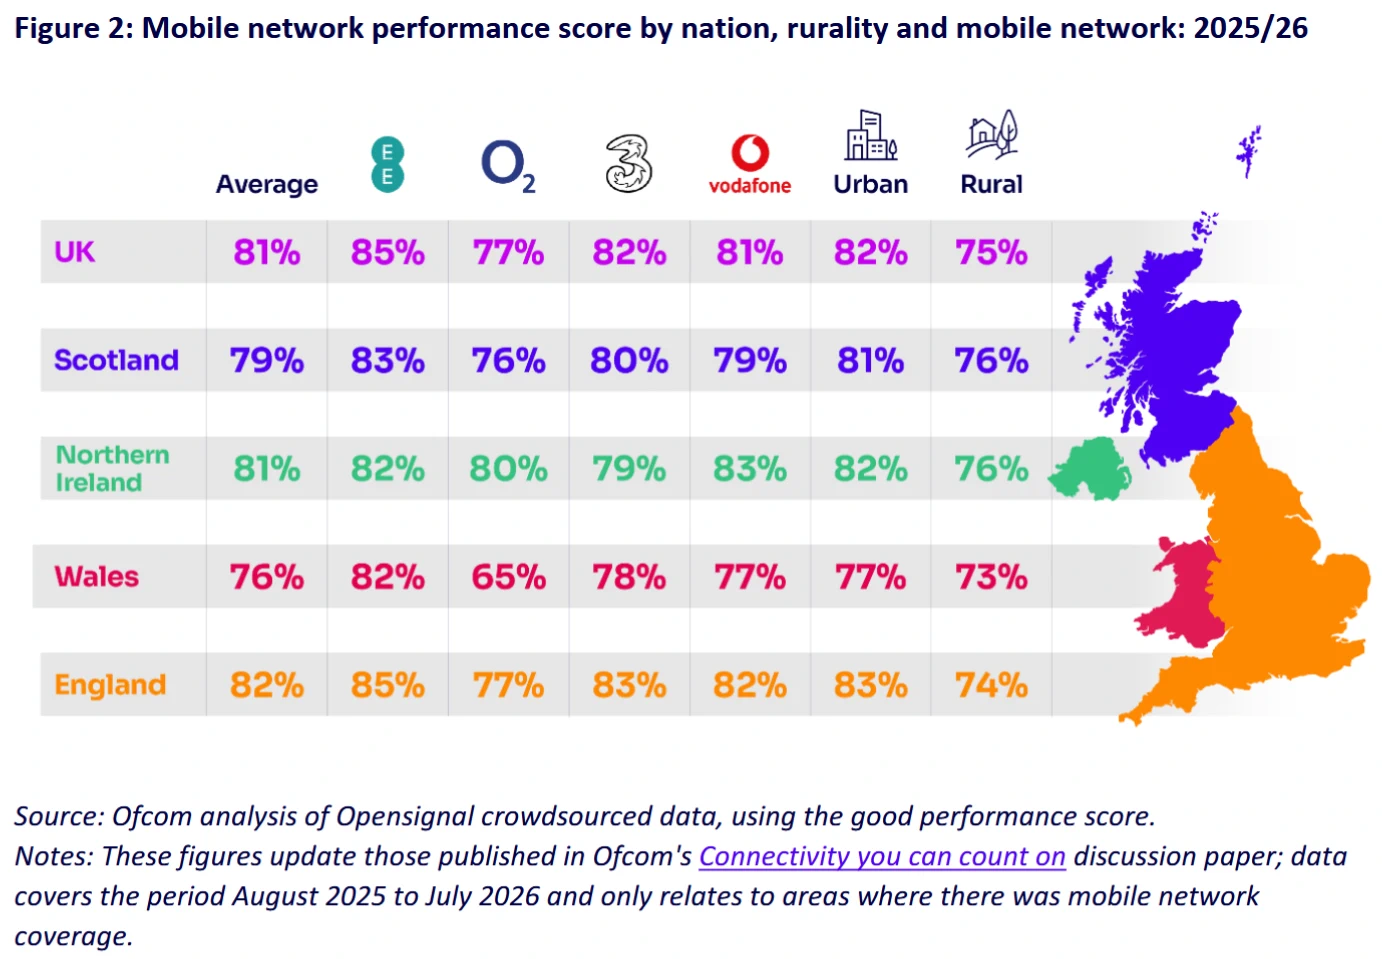
Overall, in the UK, mobile networks provided a good-quality connection 81% of the time (falling to 75% in rural areas), which Ofcom complained “falls short” of their 90% target (the level they’d expect to consistently deliver a great user experience).
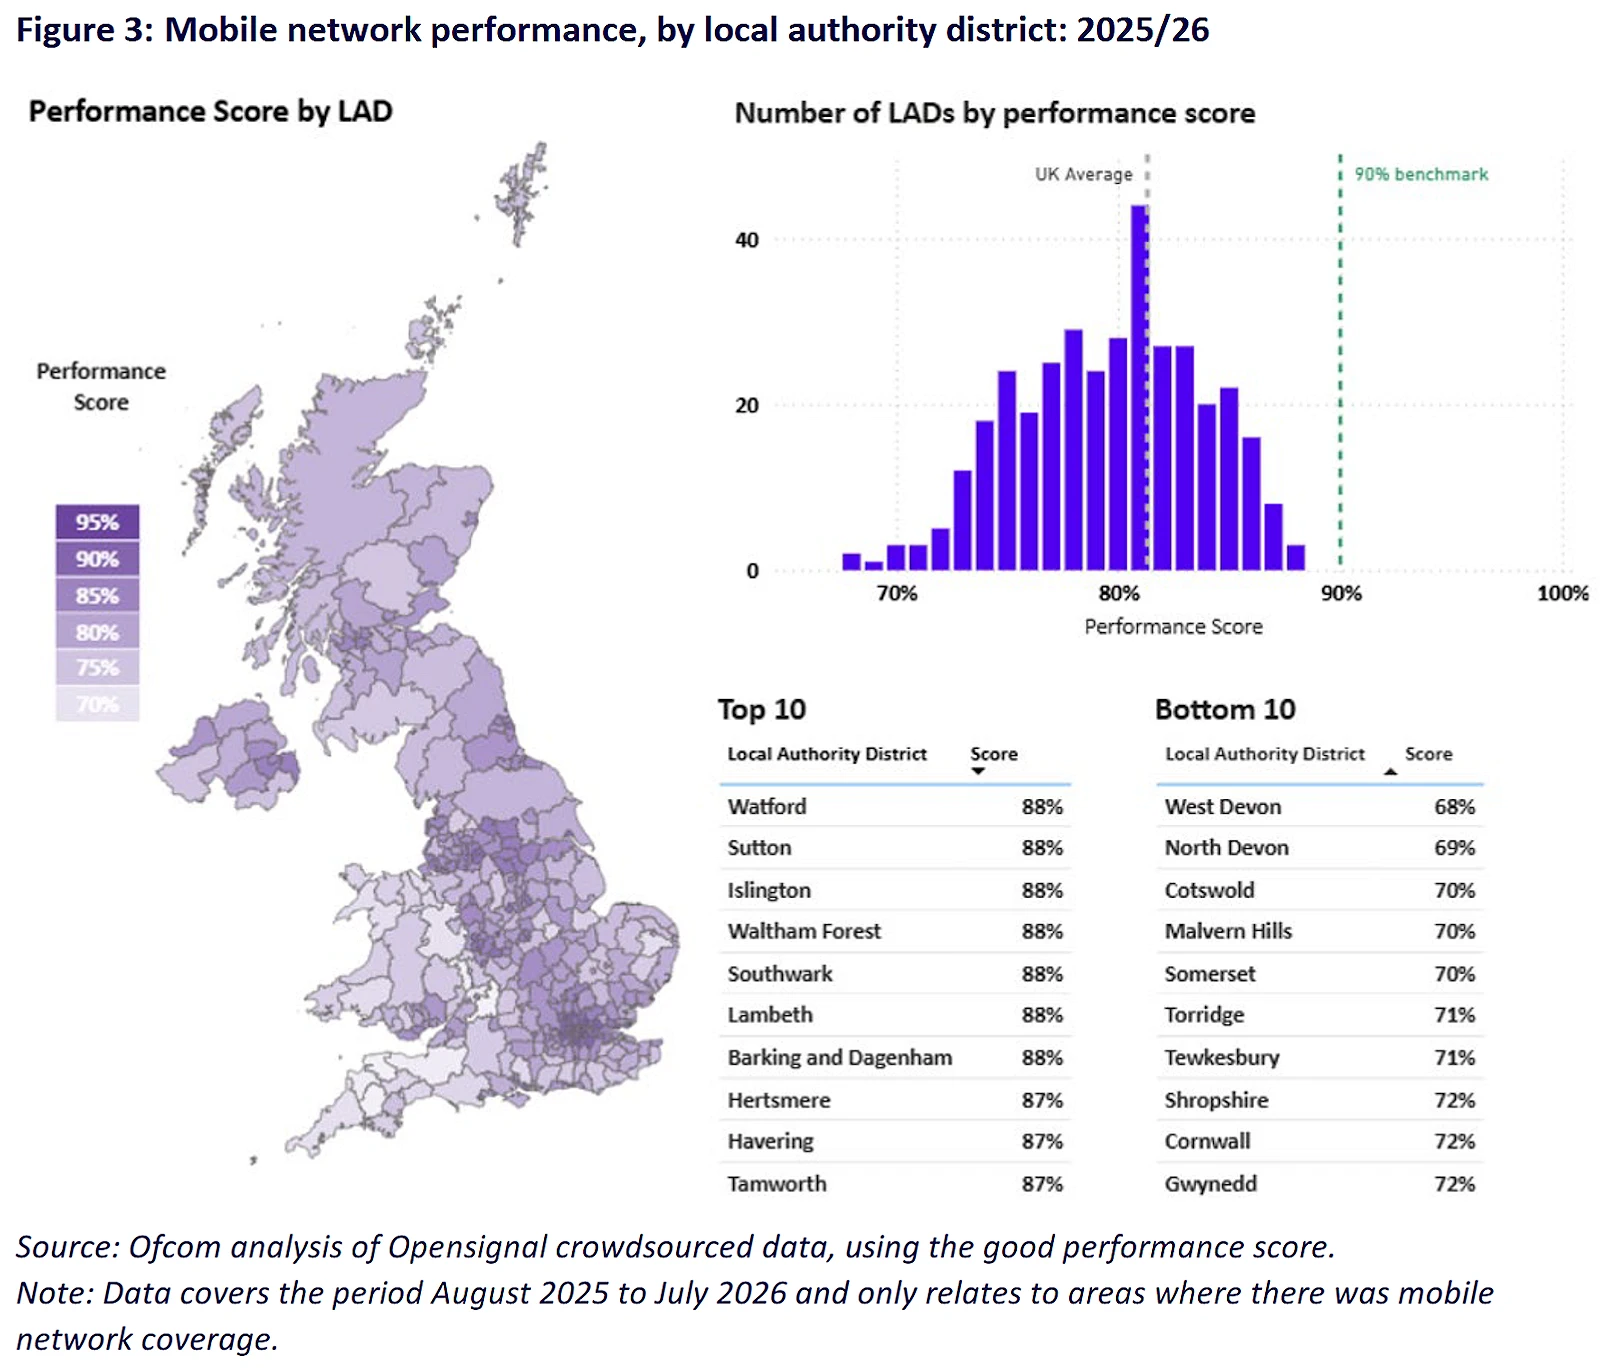
The regulator also published a list of local authority areas which are the worst in the UK for mobile performance, which sees West Devon (England) being named as the “worst local authority area” on a performance score of 68%. By comparison, Watford topped the table on 88%. None of the 360 UK local authority districts met Ofcom’s ‘good’ performance benchmark.
Advertisement
The full report remains somewhat of a scatter gun blast of information, but Ofcom does provide an expanded summary of the key highlights (see below).
Ofcom’s Mobile Matters 2026 Results
• On average, a mobile connection meeting our good performance thresholds for connection speeds and response time was achieved 81% of the time. This was below our proposed benchmark that a connection meeting these thresholds (that should deliver a strong overall user experience) ought to be met 90% of the time. The average performance score over 5G (92%) was above the proposed threshold performance, suggesting that performance scores will increase over time as 5G availability and use grows.
• There was wide variation in mobile performance among the UK’s local authority districts. Our analysis indicates that none of the 360 UK local authority districts included in our analysis10 met Ofcom’s proposed benchmark of 90% of mobile connections meeting or exceeding all of our proposed good performance score connectivity thresholds.11 There was a 20pp difference between the lowest and highest recorded local authority district performance scores, which ranged from 68% in West Devon to 88% in Watford.
• There were also variations in mobile network quality across the UK nations. At a UK-level, none of the mobile networks met Ofcom’s proposed 90% benchmark. This was also the case in each of the nations, where performance overall (i.e. across all networks) was strongest in England (with an average performance score of 82%), followed by Northern Ireland (81%); scores in Scotland (79%) and Wales (76%) were below the 81% UK average.
• EE delivered the strongest performance among the four UK networks, having the highest overall performance score (85%) and the highest scores in all the nations except Northern Ireland, where Vodafone came out top. O2 showed the lowest performance scores in three of the four nations, and the lowest overall UK score, at 77%. O2 also had the greatest variation in performance scores across the nations (from 65% in Wales to 80% in Northern Ireland), while EE was the most consistent (from 82% in Northern Ireland and Wales to 85% in England).
• Urban areas had higher performance scores than rural areas in every nation. At UK level, the average urban performance score (82%) was 7pp higher than the rural average (75%), with the largest urban/rural differences occurring in England (9pp) and Northern Ireland (6pp), compared to 5pp in Scotland and 4pp in Wales. Performance scores in selected inner-city areas, including inner London areas, were higher than average but still below the proposed 90% benchmark, ranging from 81% in Bristol and Edinburgh to 86% in London.
• Performance differences were driven by access to the faster connectivity offered by 5G. Users in all four nations experienced similar success rates when it came to making a data connection and streaming video reliably. However, differences in 5G access contributed to variations in performance between the nations and urban and rural areas, as 5G generally delivered better performance than 4G across download, upload and latency measures. Urban users also tended to benefit from faster connections than those using the same mobile technology in rural areas.
• The average 4G performance score (78%) was significantly lower than those for 5G SA and 5G NSA connections (both 92%). Across all three technologies, lower performance scores tended to be due to connections failing to meet the minimum good performance file upload and download transfer rate thresholds of 1.5 Mbit/s and 5 Mbit/s respectively,12 rather than them having a response time (latency) that exceeded the 50-millisecond threshold.
• 4G continued to be the most frequently used mobile technology across the UK, despite continued growth in the availability of 5G. 4G accounted for 75% of data connection attempts in England and in Northern Ireland, 78% in Scotland and 82% in Wales This means users in Wales may be more exposed to the relatively slower performance typically associated with 4G compared to 5G.






Mark is a professional technology writer, IT consultant and computer engineer from Dorset (England), he also founded ISPreview in 1999 and enjoys analysing the latest telecoms and broadband developments. Find me on X (Twitter), Mastodon, Facebook, BlueSky, Threads.net and Linkedin.













Advertisement
Leave a Reply
Privacy Notice: Please note that news comments are anonymous, which means that we do NOT require you to enter any real personal details to post a message and display names can be almost anything you like (provided they do not contain offensive language or impersonate a real person's legal name). By clicking to submit a post you agree to storing your entries for comment content, display name, IP and email in our database, for as long as the post remains live.
Only the submitted name and comment will be displayed in public, while the rest will be kept private (we will never share this outside of ISPreview, regardless of whether the data is real or fake). This comment system uses submitted IP, email and website address data to spot abuse and spammers. All data is transferred via an encrypted (https secure) session.

















It seems odd to measure by local authority area when (planning permission aside) it is not within the power of a local authority to do anything about it. And do you know the boundaries of your local authority? I know I don’t.
Indeed, very much a government agency doing government thinking when it’s obvious that the service consumers that they represent see this in terms of the service providers mobile networks that they buy from.
Tone deaf is the modern term for this disconnected viewpoint, I’m told.
Clearly the responsibility for service provision and quality is with the providers who are all falling short of Ofcom and consumer expectations. It’s strange not to lead this report with comparison of the providers..
I’ve been complaining for years about poor mobile service in my area, doesn’t matter what network your on, outside signals are OK to great, indoors is shocking from weak to zero service. Luckily my phone has WiFi calling so indoors is fine until my fibre goes down then I’ve got to go for outside. We’ve had a lot of new connections in the area and I’ve noticed my line goes down for 30 seconds to 5 minutes then goes live again.