BDUK Project – UK Superfast Broadband Take-up to H2 2019
The Government’s £1.8bn Building Digital UK scheme has now helped to extend “superfast broadband” (24Mbps+) ISP networks to 5,230,474 extra premises since 2012 (up by 32,038 over the past 6 months) – about 370,000 of these are FTTP – and the latest take-up data to Dec 2019 shows rising demand, averaging 62% (Phase 1).
Before we get started it’s important to point out that ISPreview have now adopted a biannual approach to summarising the BDUK figures (reported for December and June), which is because the programme has reached a high level of maturity and as such regular quarterly updates seem a bit pointless (i.e. change is more visible over a 6 month window).
Otherwise the following figures reflect the percentage % of premises (homes and businesses) that have chosen to take a 24Mbps+ capable service (usually via FTTC, FTTP or Fixed Wireless Access technology), albeit specifically those which have been delivered via state aid support under the BDUK programme (i.e. % subscribed of premises passed).
Advertisement
The data is split between the first two phases of the programme. The most recent contracts have tended to focus on remote rural areas, which since around 2018 have increasingly involved deployments of “full fibre” (FTTP) broadband networks to reflect the Government’s changing focus toward “gigabit-capable” services.
We should add that older BDUK contracts defined “superfast” as offering download speeds of 24Mbps+, while recent ones have increased this to 30Mbps+ (aligns with the definition used by Ofcom and the EU).
BDUK Phases One (Finished Spring 2016)
Supported by £530m of public money via the Government (mostly extracted from a small slice of the BBC TV Licence fee), as well as significant match funding from local authorities and the EU. The public funding is then roughly matched by BT’s private investment. Overall it helped to extend “superfast broadband” (24Mbps+) services to cover 90% of premises in the United Kingdom.
BDUK Phase Two (Technically on-going)
Supported by £250m of public money via the Government, as well as match funding from local authorities, Local Growth Deals and private investment from suppliers (e.g. BT, Gigaclear, Airband, Call Flow etc.). This phase extended superfast broadband services to 95% of premises in time for the end of 2017, but some newer contracts are on-going (e.g. the Welsh Government’s new programme).
Most of these contracts also include a clawback (gainshare) clause, which requires the suppliers to return part of the public investment as customer adoption of the new service rises. The funding from this is being reinvested to further improve network coverage and speeds via extension contracts. Efficiency savings from earlier contracts can also be reinvested, but sadly we don’t have any recent data on that (we think it could be worth c.£300m).
So far it looks as if a total of around £788m could in theory be returned via clawback from BT (here), which may rise again in the future as contracts complete. BDUK has previously estimated that this reinvestment might be enough to help boost the UK coverage of 24Mbps+ capable networks to around or even beyond 97% (we’re at about that level now), but this is NOT an official target.
Advertisement

The Universal Service Obligation (USO) mentioned above is a reference to the Government’s new legally-binding pledge to ensure that those in the final c.2-3% of premises, which may not benefit from BDUK’s effort, can still request a download speed of at least 10Mbps (details here). Sadly Ofcom’s move to accept 4G as a solution for most of this gap feels like a bit of damp squib due to the technology’s variable nature.
BDUK Phase One Take-up (Average %)
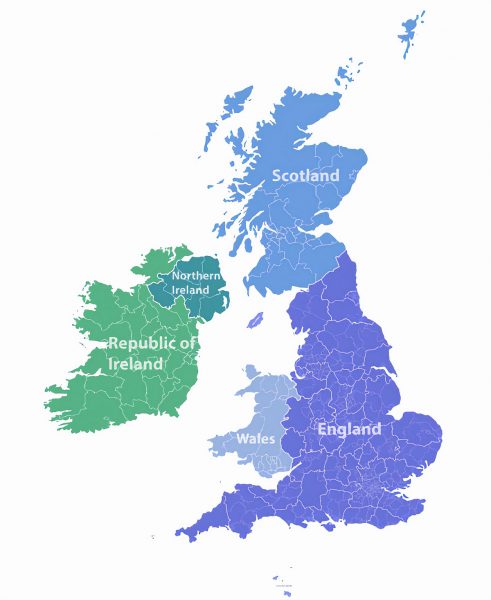
The following tables break the take-up data down by each BDUK local authority (project area) and devolved region (Scotland, Wales etc.), although for the proper context these percentages should ideally be considered alongside the most recent premises passed (network coverage) data, which can be seen at the bottom of this article. Overall 62.66% of premises have adopted the new service (up from 59.58% in June 2019).
NOTE: Some of the counties have divided their deployments into separate contracts. For example, Phase One in Shropshire doesn’t include the ‘Telford and Wrekin‘ area because that is part of a separate Phase Two contract inside the same county. On top of that the contracts were all signed at different times and so are at different stages of development.
Advertisement
| Project Area (BDUK Phase 1) | Uptake % (H1 – Jun 2019) | Uptake % (H2 – Dec 2019) |
| Berkshire Councils | 65.5 | 68.61 |
| Buckinghamshire and Hertfordshire | 68.9 | 72.11 |
| Cambridgeshire, Peterborough | 62.9 | 65.54 |
| Central Beds, Bedford Borough, Milton Keynes | 68.6 | 70.91 |
| Cheshire East, Cheshire West & Chester, Warrington, Halton | 65.5 | 68.31 |
| Devon & Somerset (including, Plymouth, Torbay, North Somerset, Bath & NE Somerset) | 60 | 63.61 |
| Coventry, Solihull, Warwickshire | 67.7 | 70.27 |
| Cumbria | 60.6 | 64.48 |
| Derbyshire | 58.9 | 62.85 |
| Dorset, Bournemouth and Poole | 60 | 63.85 |
| Durham, Gateshead, Tees Valley and Sunderland | 58.9 | 63.01 |
| East Riding of Yorkshire | 63.2 | 66.6 |
| East Sussex, Brighton and Hove | 65.4 | 68.81 |
| Essex, Southend-On-Sea, Thurrock | 64.8 | 68.5 |
| Greater Manchester | 55.1 | 60.22 |
| Hampshire | 62.6 | 66.08 |
| Herefordshire and Gloucestershire | 59.7 | 63.13 |
| Isle of Wight | 58.1 | 61.73 |
| Kent and Medway | 63.2 | 66.99 |
| Lancashire, Blackpool, Blackburn with Darwen | 56.8 | 60.89 |
| Leicestershire | 63.8 | 67.33 |
| Lincolnshire | 63 | 66.44 |
| Merseyside | 53 | 57.74 |
| Newcastle upon Tyne | 55 | 59.5 |
| Norfolk | 62.8 | 66.78 |
| North Lincolnshire, North East Lincolnshire | 61.2 | 65.44 |
| North Yorkshire | 58.2 | 58.21 |
| Northamptonshire | 66.8 | 69.5 |
| Northumberland | 63.7 | 65.82 |
| Nottinghamshire | 62.2 | 65.9 |
| Oxfordshire | 66.6 | 68.43 |
| Rutland | 67 | 69.86 |
| Shropshire | 61.3 | 64.84 |
| Staffordshire and Stoke-on-Trent | 59.8 | 63.62 |
| Suffolk | 64.4 | 67.59 |
| Surrey | 66.6 | 70.02 |
| West Sussex | 66.7 | 68.92 |
| West Yorkshire | 57.8 | 62.11 |
| Wiltshire | 64.8 | 67.79 |
| South Gloucestershire | 66.5 | 68.93 |
| Worcestershire | 65.8 | 68.77 |
| Devolved Administrations | ||
| Highlands and Islands | 60.1 | 63.85 |
| Northern Ireland | 67.7 | 69.2 |
| Rest of Scotland | 55.2 | 59.8 |
| Wales | 51.8 | 51.77 |
BDUK Phase Two Take-up (Average %)
So far in this phase an overall total of 48.54% of premises have adopted the new service (up from 44.02% in June 2019), although some projects have yet to report. We note that a number of Phase 2 schemes also consist of more than one contract and so you may see several figures being reported for certain areas in order to reflect each of those deals (this is sadly very confusing but that’s just how they do it).
Both of the recent contracts in Scotland and Wales will also be covered in this table because they have received some funding from the original BDUK programme. The Welsh programme (mostly FTTP) only recently started deployment and has just reported its first extremely early take-up figure of nearly 3%, which is good considering they’ve only just begun.
| Project Area (BDUK Phase 2) | Uptake % (H1 – Jun 2019) | Uptake % (H2 – Dec 2019) |
| Berkshire | 26, 3.7, 27.4 | 27.66, 5.62, 35.01, 2.17 |
| Black Country | 44.2 | 51.74 |
| Bucks & Herts | 47.2 | 52.06 |
| Bedfordshire & Milton Keynes | 48.2 | 56.27 |
| Cambridgeshire | no data | no data |
| Cheshire | 51.9 | 58.31 |
| Cornwall | 51.1, 24.1 | 55.88, 34.07 |
| Cumbria | 44.3 | 49.32 |
| Derbyshire | 40.5 | 40.66 |
| Devon & Somerset | 10.1, 5, 26 | 10.13, 9.85 |
| Dorset | 57.1, 8.4 | 62.64, 16.05 |
| Durham | 46.1 | 53.51 |
| East Riding (Yorkshire) | 55.1 | 60.7 |
| East Sussex | 54.1 | 61.95, 7.42 |
| Essex | 48.2, 26.6, 2, 13.9, 0.3 | 56.03, 26.61, 5.82, 21.68, 1.9, 13.37, 3.91, 2.28 |
| Greater Manchester | no data | no data |
| Hampshire | 45.7 | 51.38 |
| Herefordshire & Gloucestershire | 37.4, 6, 11, 6.7, 3.2, 16.7, 18.7 | 37.42, 12.04, 12.38, 8.53, 6.14, 26.14, 41.84 |
| Hertfordshire | no data | no data |
| Kent | 59.9 | 65.23 |
| Lancashire | 42.8 | 47.71 |
| Leicestershire | 45.2 | 52.45 |
| Lincolnshire | 44.9 | 50.08 |
| Norfolk | 52.4 | 56.33 |
| North Lincolnshire | 46.2 | 52.71 |
| North Yorkshire | 56.4, 14.7 | 56.36, 19.56 |
| Northamptonshire | 53.7, 12.9, 11.8 | 58.96, 11.85, 10.8 |
| Northumberland | 49.8 | 50.77 |
| Nottinghamshire | 47 | 50.42, 49.95 |
| Oxfordshire | no data | 5.68 |
| Rutland | no data | no data |
| Shropshire | 47.1, 2.2 | 57.13, 1.58 |
| South Gloucestershire | 50.8, 23.9 | 58.95, 20.75 |
| South Yorkshire | 46.7 | 53.16, 3.08 |
| Staffordshire | 44.4 | 51.12 |
| Suffolk | 51.4 | 57.18 |
| Swindon | 9 | 8.68 |
| Telford & Wrekin | 59.7 | 64.46 |
| Warwickshire | 46.9, 6 | 55.49, 10.39 |
| West Oxfordshire | 8 | 11.64 |
| West Sussex | 52.8 | 58.67 |
| West Yorkshire | 42.3 | 48.21 |
| Wiltshire | 50.6, 0.9, 16.5 | 54.8, 7.54, 21.52 |
| Worcestershire | 53.9 | 55.43, 20.13 |
| Devolved Administrations | ||
| Highlands and Islands | no data | no data |
| Northern Ireland | 46.2 | 50.77 |
| Rest of Scotland | no data | no data |
| Wales | no data | 2.73, 2.58, 2.59 |
IMPORTANT: Take-up is a dynamically scaled measurement, which means that at certain stages of the scheme it may go up or even down depending upon the pace of deployment (i.e. premises passed in any given time-scale), although over time the take-up should only rise.
Explained another way, earlier phases of the roll-out were easier and faster to deploy, so you could expect to see a bit of a yo-yo movement with the take-up % sometimes falling if lots of new areas were suddenly covered. Some contracts are also younger than others and will thus take time to catch-up. On top of that BDUK’s roll-out pace has slowed to a crawl as it reaches remote rural areas, which will give take-up a chance to climb.
A number of other factors can also impact take-up, such as the higher prices for related “fibre” services, as well as customers being locked into long contracts with their existing ISP (they can’t upgrade immediately) and a lack of general awareness (locals don’t always know that the faster service exists) or interest in the new connectivity (if you have a decent ADSL2+ speed and only basic needs then you might feel less inclined to upgrade).
The fear of switching to a different ISP may also obstruct some services. In other cases the new service may run out of capacity (i.e. demand is higher than expected), which means that people who want to upgrade are prevented from doing so until Openreach resolves the problem, although the scale of this issue is fairly small.
Now, for some context, here’s the latest progress report on related contracts for the same period (this doesn’t show any match-funding from private investment).
Funding and Premises Passed Progress (BDUK Phase 1 + 2)
| Total BDUK Contracted Funding | Total LB Contracted Funding | Current Total Contracted Premises | Delivered to Date (Dec 2019) | |
| Bedford & Milton Keynes | £8,130,000 | £9,443,694 | 52,530 | 50,935 |
| Berkshire | £5,153,017 | £4,603,250 | 40,907 | 32,296 |
| Black Country | £2,988,349 | £2,988,349 | 37,302 | 37,389 |
| Bucks & Herts | £10,837,000 | £11,415,000 | 93,695 | 89,646 |
| Cambridgeshire | £8,250,000 | £21,895,592 | 111,901 | 105,248 |
| Cheshire | £6,461,000 | £16,091,055 | 82,039 | 82,210 |
| Cornwall | £5,960,000 | £13,728,108 | 14,988 | 13,564 |
| Cumbria | £19,959,519 | £18,798,000 | 121,780 | 121,298 |
| Derbyshire | £9,579,550 | £9,580,000 | 103,737 | 98,453 |
| Devon & Somerset | £40,029,305 | £30,317,110 | 298,251 | 294,871 |
| Dorset | £13,741,841 | £16,051,546 | 79,466 | 78,054 |
| Durham | £13,189,267 | £12,166,000 | 116,744 | 111,656 |
| East Riding (Yorkshire) | £10,507,459 | £8,393,079 | 51,661 | 49,753 |
| East Sussex | £13,640,000 | £13,000,000 | 70,015 | 63,936 |
| Essex | £14,254,755 | £19,296,658 | 158,848 | 135,359 |
| Greater Manchester | £3,440,000 | £5,923,000 | 41,363 | 40,062 |
| Hampshire | £15,262,307 | £14,261,230 | 110,498 | 100,764 |
| Herefordshire & Gloucestershire | £31,090,658 | £34,512,090 | 161,428 | 132,462 |
| Hertfordshire | £0 | £879,471 | 546 | 0 |
| Highlands & Islands | £50,830,000 | £75,600,000 | 150,997 | 150,567 |
| Isle of Wight | £2,490,000 | £2,490,000 | 17,617 | 17,649 |
| Kent | £17,063,509 | £14,998,391 | 144,131 | 138,401 |
| Lancashire | £14,670,000 | £22,540,000 | 147,334 | 145,432 |
| Leicestershire | £7,968,895 | £10,884,318 | 75,149 | 72,760 |
| Lincolnshire | £16,110,000 | £17,910,000 | 135,710 | 135,032 |
| Merseyside | £5,460,000 | £4,374,000 | 43,905 | 43,966 |
| Newcastle | £970,000 | £941,158 | 6,760 | 6,697 |
| Norfolk | £24,650,000 | £26,153,767 | 213,716 | 200,203 |
| North Lincolnshire | £4,181,242 | £1,880,963 | 29,292 | 29,344 |
| North Yorkshire | £28,160,000 | £25,804,726 | 175,283 | 170,052 |
| Northamptonshire | £9,856,669 | £11,009,000 | 79,349 | 75,532 |
| Northern Ireland | £11,454,000 | £21,954,000 | 66,907 | 67,173 |
| Northumberland | £10,687,867 | £12,016,750 | 49,620 | 49,097 |
| Nottinghamshire | £7,850,000 | £9,288,644 | 67,387 | 67,525 |
| Oxfordshire | £8,184,500 | £20,045,470 | 79,103 | 78,249 |
| Rest of Scotland | £50,000,000 | £107,575,000 | 581,999 | 586,607 |
| Rutland | £1,000,000 | £1,670,000 | 7,066 | 9,835 |
| Shropshire | £19,317,466 | £12,722,000 | 69,697 | 67,147 |
| South Gloucestershire | £3,370,000 | £3,521,123 | 19,802 | 19,645 |
| South Yorkshire | £10,395,000 | £13,353,577 | 102,887 | 96,931 |
| Staffordshire | £9,620,000 | £7,543,413 | 80,567 | 80,704 |
| Suffolk | £26,940,000 | £27,769,703 | 131,832 | 123,689 |
| Surrey | £1,310,000 | £19,020,081 | 79,407 | 78,616 |
| Swindon | £950,000 | £950,000 | 20,159 | 17,010 |
| Telford & Wrekin | £2,157,000 | £1,843,000 | 8,822 | 8,698 |
| Wales | £69,040,000 | £180,651,507 | 754,921 | 703,951 |
| Warwickshire | £14,557,172 | £14,557,172 | 73,940 | 62,148 |
| West Oxfordshire | £1,600,000 | £1,556,675 | 4,788 | 2,961 |
| West Sussex | £8,011,243 | £7,510,000 | 53,771 | 53,617 |
| West Yorkshire | £11,019,827 | £11,175,487 | 100,368 | 96,853 |
| Wiltshire | £9,270,000 | £16,496,000 | 81,636 | 75,988 |
| Worcestershire | £8,387,032 | £11,403,641 | 63,043 | 60,439 |
| £700,005,449 | £980,552,798 | 5,464,664 | 5,230,474 |
The above figures only include 24Mbps+ capable premises in BDUK intervention areas.


Mark is a professional technology writer, IT consultant and computer engineer from Dorset (England), he also founded ISPreview in 1999 and enjoys analysing the latest telecoms and broadband developments. Find me on X (Twitter), Mastodon, Facebook, BlueSky, Threads.net and Linkedin.


« COVID-19 – Mobile and Broadband ISPs Agree Extra NHS Support
Vodafone Attract the Most Broadband ISP Complaints – Q4 2019 »


The only question given the funds within the process and contracted not delivered, is why not finish the job? There are ~800k premises to go of which half are either contracted or about to be contracted with Stratum, R100, and some in Wales reducing this number.
There is still no evidence of the status of BT’s matched funding to the allowable costs for each project. Lots of opex and overheads no doubt, but nothing on the contractual and state aid requirement to pay a proportion of the direct costs in a gap funding model.
I also believe your under reporting the FTTP rural. Think Broadband ascribed more than ~500k to BDUK recently to which 85k can be added for Cornwall.
The efficiencies and savings are the same as the inflated costs reported by the NAO in 2015. They found the 2012 BT Group cost models had been inflated by 38%, which is close to the amount of direct capital contribution ought to be making, so there is perhaps more possible.
It will be hugely successful if the job is completed and reported on more fully. This would permit rather numbers of rural exchanges to be near ready for the transition to full fibre. 40 of the 180 exchanges announced are Tier1.
“I also believe your under reporting the FTTP rural. Think Broadband ascribed more than ~500k to BDUK recently to which 85k can be added for Cornwall.”
The 370,000 figure is not ours, it’s the official one that the Government published as part of their Budget 2020 announcement (as per the article link). The original BT/EU Cornwall project was of course not BDUK.
The 370k is out of date, but Cornwall is state aid, and while the contractual model is not exactly the same there are similarities.
Why can the work not be concluded, especially given the £5bn election money is likely to dis-appear due to the impact of Covid-19?
The tbb figure quoted will include Cornwall already.
There is a reason it carries the bduk/gap funded or other rural intervention label.
@AF Thanks for the clarification.
I highly doubt that the Government will abandon their £5bn commitment, but we’ll have to see. Usually infrastructure spending takes priority during heavy recessions and investment in broadband is well understood for its tangible returns.
The incremental benefit of getting to 24Mbps-30Mbps is understood using full fibre where needed to do so, or delivering a shared data transport infrastructure with a peak per user of 1-2Mbps. The incremental benefit of all fibre is better expressed in the cost savings to the operator.
The additional benefits to SMEs is removing the discretion to mis-sell private or partial private circuits, hence the importance of being able to make a reasonable request.
IMHO both election promises were whims where the £5bn and its 2025 timescale was just less stupid than the Labour alternative. We will find out soon, but the funds within the BDUK process are likely to be the only chance in this generation to complete the rural work started in 2012.
@NGA – What’s ‘a reasonable request’
@Facts In WLA 2017 Ofcom while stating BT was obliged to respond to a ‘reasonable request’ for a full or partial fibre service, Ofcom did not go to the trouble of defining it. The work is still outstanding.
It is likely to follow the PSTN access lines should Ofcom get out of bed on the matter.
@NGA – And I guess will never be defined as there are now a number of suppliers who can supply services. Also fibre is a method of delivery not the specification for a requirement. And there would be of the issue of at what cost.
@Facts Disagree. It should not be too difficult to outline for instance if connectorised block is installed on a pole then x happens, if a splitter is with x metres y happens, if a spare fibre is available adjacent to subsidised can then other conditions apply. Ofcom had not got as far as differentiating between handover points and exchanges in 2017.
It continues to be more a resource issue. BT committed to fibre on demand in 2014 everywhere, in all exchanges and then defined it as if they were delivering a private circuit in order to kick the can down the road.
The premises passed figures show how little progress is actually being made – for Herefordshire & Gloucestershire the premises passed has gone up by just under 8000 since the Q4 2018 figures over a year ago. The scope has increased by just over 9000 premises, so they have more remaining to build than they had a year ago. With 31000 premises still in plan it will take another 4 years (and as the build seems to be getting slower and slower, probably much longer).
Yet the funds are there to complete the works. Very frustrating.
Remember there will be time lags before new contracts are agreed and build on those can begin, as well as ramp-up and ramp-down periods. Likewise the roll-out pace, particularly when using FTTP in remote rural areas (this is where that remaining BDUK is focused), is considerably slower by virtue of the environment and sparse population density. No surprise that it’s a slow expensive slog, that is just reality with full fibre.
There are definitely time-lags – Gigaclear won their Fastershire contracts over 3 years ago, and yet my area still doesn’t even have a rollout plan (they have rewritten the plan several times, but don’t make it visible to the public, then a few months later they scrap it and start planning again). Fastershire still claim the build in my area will start in Q1 2020, but it took them months to admit that the completion date of Q4 2018 wasn’t possible.
The costs of ramping up and down is a function of the gaming of cost and capital. This led to the greater separation of Openreach from BT Group. You would not need to ramp up and down as much if there were trusted relationships and more transparency.
It is good to see Openreach engineers speak out in other forums on the imbecility of BT Group managers (telecoms now), some now in Openreach effectively slowing progress in order to optimise cash flow in the short term at the expense of the engineering with no long term gain for customers or shareholders. Herefordshire is a good example, but it is good to see Burleygate, Harewood End, and Canon Pyon on the full fibre transition list.
Gigaclear’s problem is that they promised a highly optimistic time-scale when agreeing their contracts and then failed to correctly plan, manage and resource for it all. The new owners have done a better job but of course people are still having to suffer massive delays. No easy fix for that.
CDS obviously took the nuclear option with their contract – scrapped it and went hunting for another supplier.. for something like the 3rd time in a row. I suspect, after all is said and done, they may end up back with BT again – tails between legs etc.
If CDS has gone with BT all the way though from the first contracts they’d have been done long ago.
How can someone say “superfast” and 24mbit and keep a straight face.
Ask the Government and Ofcom, these are their definitions. Hence why I always stick them in speech-marks 🙂 . Same with “ultrafast”. But at least with the latest “gigabit-capable” slogan there’s actually some reflection of the expected performance in the wording.
Or the 4 Mbit I get from my ‘fibre’ broadband?
Or the 10 Mbit Universal Service Obligation where I am getting sold 4G.
I bought 4G. Given how bad the ADSL, it could not be worse could it?
The 4G is also sh!t averaging around 2 Mbit with high latency, and never close to 10Mbit.
Thre is a written question and answer
Department for Digital, Culture, Media and SportBroadband: Standards43205
To ask the Secretary of State for Digital, Culture, Media and Sport, how many properties receive broadband with speeds less than 30Mbps in (a) High Peak constituency, (b) Derbyshire and (c) the UK.
on the parliament web site
https://www.parliament.uk/business/publications/written-questions-answers-statements/written-questions-answers/?page=1&max=20&questiontype=AllQuestions&house=commons%2Clords&member=4852
with links to data.
This article misleadingly describes BDUK Phase 2 as “technically ongoing”. Tell that to residents in 83% of rural Devon & Somerset where thanks to the incompetence of Connecting Devon & Somerset, CDS will not have a contractor in place until the beginning of 2021 and some people/properties who have now waited 8 years since CDS Phase 2 was funded by BDUK may not get better broadband until 2025. CDS have failed three times to put contracts in place for five sixths (83%) of rural Devon & Somerset and three times they have failed to achieve that. To make a mistake the first time is a learning experience. To make the same mistake a second time is an error. To make the same mistake a third time is incompetence and CDS HAVE NOW DEMONSTRATED THEIR INCOMPETENCE AND THE WHOLE PROJECTED NEEDS TO BE TAKEN OUT OF THEIR HANDS AND THE HANDS OF THE TWO FAILED COUNTY COUNCILS.
I may be missing something but that only reinforces the “technically on-going” statement because it is indeed on-going, even in CDS land, and beyond the original UK coverage target of 95%. In other areas clawback reinvestment through the BDUK framework is being used to extend coverage more successfully.
Meanwhile Scotland and Wales have used some BDUK Phase 2 funding in their recent contracts. The UK is much larger than just Devon and Somerset, Graham.
Just cus you live in Dorset Mark 😉