Average UK Spend on Communications Services Falls for First Time Since 2013
Ofcom has today published their annual 2018 Communications Market Report (CMR), which reveals the latest information about the take-up and impact of Broadband, Mobile, Phone, TV and Radio services across the United Kingdom (England, Scotland, Wales and N.Ireland).
The CMR is typically quite broad and due to that we’ll tighten our focus by summarising the key fixed line broadband, mobile (3G / 4G) and internet connectivity data points instead. We should add that lot of the data in Ofcom’s report has already been published in other studies (e.g. fixed broadband speeds) and it doesn’t include any new coverage info. for digital networks (this is saved for their Connected Nations Update).
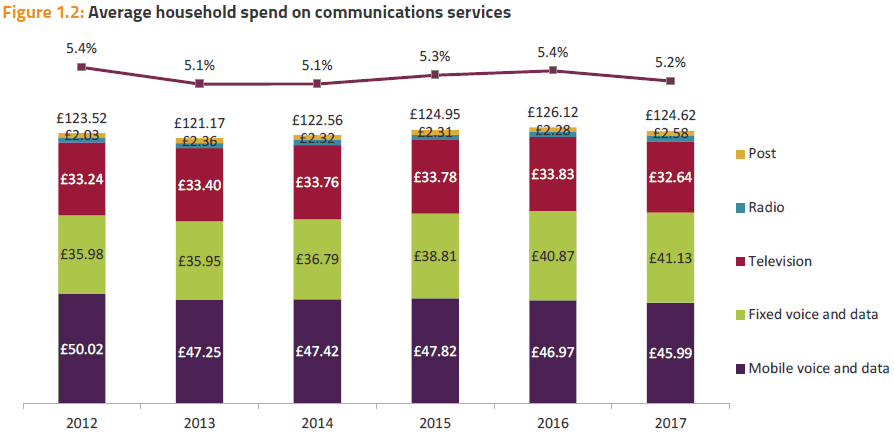
Nevertheless there are a few interesting developments, such as the fact that the average monthly household spend on communications services (70% of this comes from telecoms) has decreased for the first time since 2013, falling by 1.2% from £126.18 in 2016 to £124.62 in 2017.
Advertisement
However, when only looking at telecoms services (broadband, phone and mobile), the average monthly spend has increased from £83.21 in 2013 to £87.13.
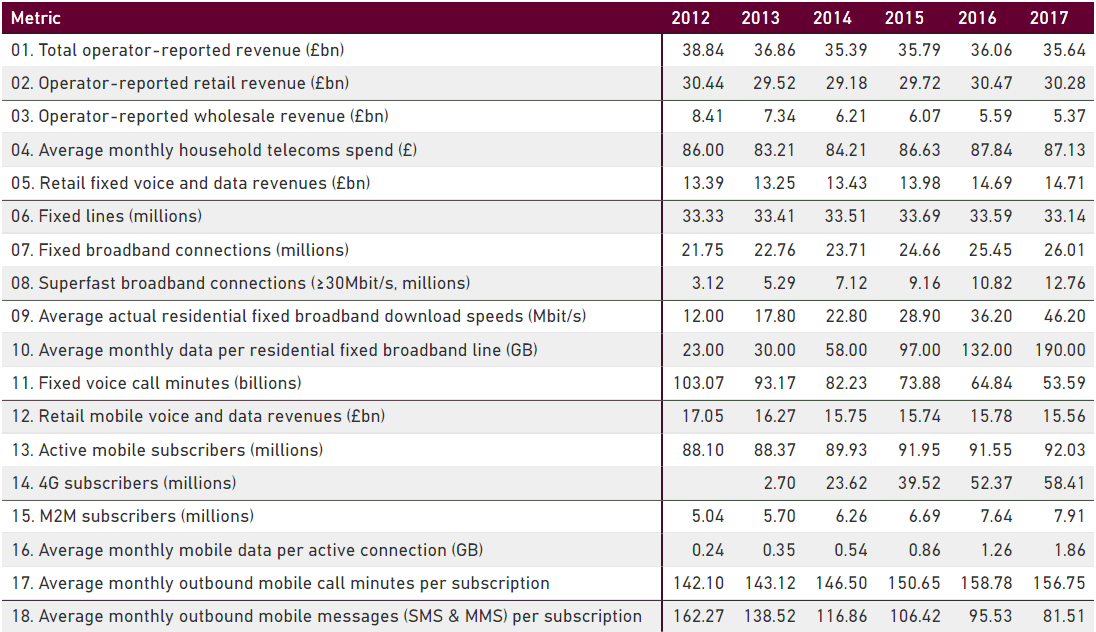
Given the above it will come as little surprise that the total UK communications revenues generated by telecoms, TV, radio and postal services combined declined by £1.1bn (-2.1%) in 2017 to £54.7bn, its lowest level in the last five years. Telecoms revenue alone fell by 1% to £35.6bn in 2017, although retail landline and data revenues were unchanged during the year (i.e. the fall came from a decline in mobile revenues).
Despite the fall in mobile revenues, it’s worth noting that the majority (62%) of time spent on the internet was on mobile devices, and mobile advertising made up 45% of online advertising in 2017. Otherwise a rough summary of all the key telecoms related statistics can be found below.
Advertisement
Ofcom also noted that the take-up of fixed broadband services has “plateaued” at 80% (it’s fallen from 82% last year), while accessing the internet on a mobile phone continues to grow, from 66% in 2017 to 72% in 2018. Almost eight in ten UK adults (78%) were also found to personally use a Smartphone.
Household Take-up of Telecoms Communications Services
| 2012 | 2013 | 2014 | 2015 | 2016 | 2017 | 2018 | |
| Mobile telephony | 94% | 94% | 95% | 95% | 95% | 96% | 96% |
| Fixed telephony | 84% | 84% | 84% | 84% | 86% | 82% | 81% |
| Internet connection | 79% | 80% | 82% | 85% | 86% | 88% | 87% |
| Fixed broadband | 72% | 72% | 73% | 78% | 79% | 82% | 80% |
| Smartphone | 39% | 51% | 61% | 66% | 71% | 76% | 78% |
| Internet on mobile (personal) | 39% | 49% | 57% | 61% | 66% | 66% | 72% |
| Mobile broadband dongle or datacard | 13% | 5% | 8% | 6% | 4% | 2% | 2% |
Meanwhile 79% reported purchasing at least two of their communications services as a bundle from the same supplier in H1 2018, in line with the last two years (81% and 79%). By comparison dual-play packages of landline and broadband, and triple-play packages of landline, broadband and TV were the most popular, both at 31% of households.
Advertisement
Overall some 86% of consumers said they were either fairly or very satisfied with their fixed line voice service, which rises to 92% for mobile services and then falls to 80% for customers of a fixed broadband connection.
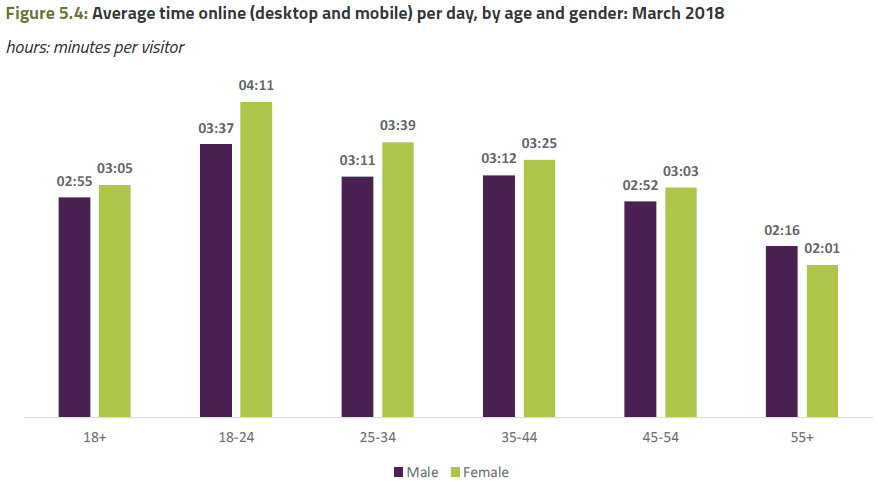
Finally, most internet connected users spend several hours online per day. Overall people claimed to spend a total of one day a week online (24 hours), more than twice as much as in 2011.
The full report can be read below.
Ofcom 2018 CMR
https://www.ofcom.org.uk/../cmr-2018
Mark is a professional technology writer, IT consultant and computer engineer from Dorset (England), he also founded ISPreview in 1999 and enjoys analysing the latest telecoms and broadband developments. Find me on X (Twitter), Mastodon, Facebook, BlueSky, Threads.net and Linkedin.


« First Draft – Openreach Offers Cheaper Access to its UK Cable Ducts
Vodafone UK Home Broadband Offers Gadgets Worth up to £200 »


Comments are closed