Connected Nations 2021 – UK Gigabit Broadband Cover Hits 47%

Ofcom has released their Connection Nations 2021 UK digital infrastructure report, which reveals that the coverage of “gigabit-capable” (1Gbps+) broadband ISP networks has jumped from 27% last year to 47% now (13.7 million households). Plus, around half of UK properties are in areas where 5G mobile is available outside.
The report provides a general summary of broadband and mobile network availability and data usage from across England, Scotland, Wales and Northern Ireland, although it’s largely based off data that was gathered a few short months ago (September 2021). As a result, it doesn’t recognise the recent completion of Virgin Media’s upgrade,which just pushed gigabit coverage to around 65% (vs the 47% in today’s report).
Before we begin, it’s important to note how Ofcom defines the different performance classes of fixed broadband. In that sense, “Decent Broadband” means a 10Mbps+ download speed with 1Mbps+ uploads (i.e. the Universal Service Obligation), while “Superfast” is 30Mbps+, “Gigabit” equates to 1Gbps+ (1000Mbps+) and “Full Fibre” essentially means a pure Fibre-to-the-Premises network (these are also gigabit capable).
Advertisement
One key addition this year is that Ofcom has finally started tracking the coverage of the new 5G mobile networks, which is beginning to make a dent (more on that later). Otherwise, we’ve split our summary of the key results from this report into categories for fixed line broadband and mobile.
Fixed Line Broadband Coverage
Much like last year, 2021 has been all about the ongoing deployment of FTTP broadband networks by various providers (Summary of UK Full Fibre Build Progress) and the completion of Virgin Media’s rapid upgrade to DOCSIS 3.1 technology (here), both of which have predominantly focused upon urban areas. All of this reflects the fact that commercial investment is still driving the gigabit rollout.
The Government’s new £5bn Project Gigabit ambition, which aims to make gigabit speeds available to at least 85% of UK premises by the end of 2025 and universal coverage by 2030 (here), is likely to change this picture because that has a focus on supporting those in the hardest to reach final 20% of premises. However, deployments under that programme won’t even start until later next year.
Overall, the picture today is that UK “full fibre” network coverage has risen from 3% in 2017, to 6% in 2018 (1.8 million premises), 10% in 2019 (3 million premises), 18% (5.1 million premises) in 2020 and now stands at 28% (8.2 million premises). Meanwhile, “gigabit” coverage, which is being driven by both “full fibre” and DOCSIS 3.1 networks (there’s a fair bit of overbuild between these), has grown from 27% last year to 47% now (much of the jump in 2021 was down to Virgin’s DOCSIS 3.1 upgrade of existing Hybrid Fibre Coax lines).
Advertisement
Meanwhile, “superfast” coverage held steady at 96% or 28.1m premises (but only 83% in rural areas) and the number of premises that cannot get a “decent broadband” (10Mbps+) service is 0.4% or 123,000 premises (down from 0.6% or 190k premises last year). However, this is only true if you include 4G and fixed wireless coverage into the 10Mbps figure, but if you only looked at fixed line solutions it would be c.2% (651,000 premises). Sadly, many of those that remain in sub-10Mbps areas are often too expensive for even the USO to fix (here and here).
Ofcom also provides some useful data on the rural vs urban coverage split for superfast, full fibre and gigabit broadband lines, which we’ve included below for added context – split by region.
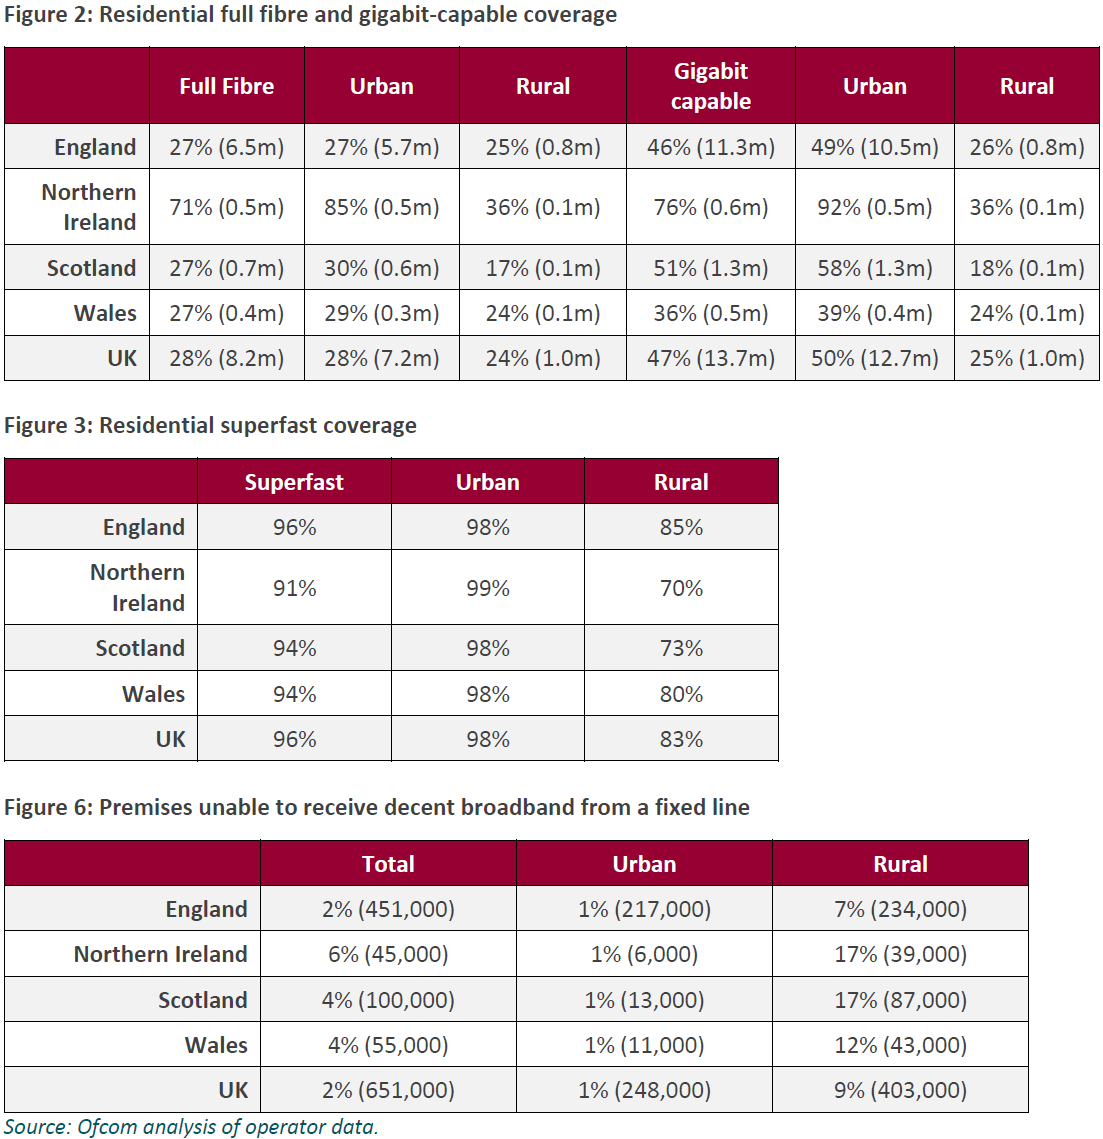
In terms of take-up, some 69% of UK connections are now “superfast” (up from 60% last year, 57% in 2019, 45% in 2018, 38% in 2017 and 31% in 2016). Meanwhile, 24% have taken a “full fibre” network, which is actually down from 25% last year and 30% in 2019. The reason for that is likely to stem from the rapid pace of build (i.e. building at a faster pace than people can sign-up), which can suppress the adoption figures until build slows.
Advertisement
As for the take-up of gigabit (1Gbps+) services, Ofcom states that “around 7% of full fibre customers [are] taking these higher speed services“, which means that they haven’t included Virgin Media’s new 1Gbps package on HFC networks into that figure.
Elsewhere, the average monthly data volume per household on fixed broadband connections has increased over the past year to 453 GigaBytes (up from 429GB last year, 315GB in 2019 and 241GB in 2018). We couldn’t see a similar figure for mobile / mobile broadband networks (still checking), but Ofcom’s recent CMR 2021 report stated that the average use per mobile data user was up by 27% to 4.5GB per month.
Lindsey Fussell, Ofcom’s Network and Communications Group Director, said:
“Many families now have multiple devices on the go at the same time for work, learning and entertainment – and the festive holidays can see a particular battle for bandwidth.
Full fibre is helping meet those demands, with millions more benefitting from faster speeds and more reliable connections. But some homes in hard-to-reach areas still struggle to get decent broadband, so there’s more work to do to make sure these communities get the connections they need.”
Mobile Coverage
The report includes coverage data for mobile networks, such as via the usual 2G (voice & text), 4G and now 5G based platforms that most people should be familiar with. The UK has four primary network operators (MNO) – O2 (VMO2), Three UK, EE (BT) and Vodafone – plus an assortment of virtual operators (MVNO) that piggyback off those.
Ofcom found that between 79% to 86% of the UK’s landmass can access a 4G network if you look across all operators (up slightly from 79% to 85% last year) – with EE having the strongest coverage of 86%. The new £1bn Shared Rural Network agreement aims to push geographic 4G coverage to 95% from any one operator by the end of 2025 (here), but historically similar efforts have struggled to deliver on their promises.
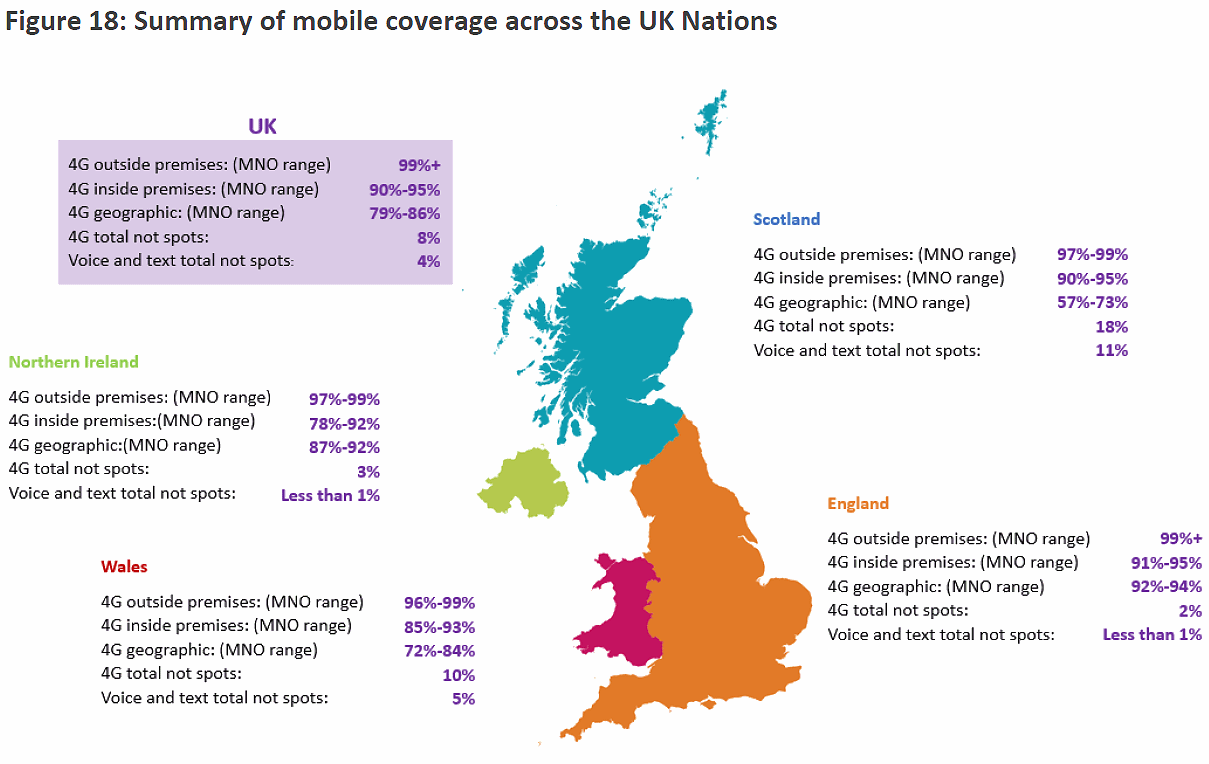
The map above doesn’t include 5G, but Ofcom has given us our first solid data on related coverage. The regulator found that 5G is available from at least one MNO (operator) in the vicinity of around 42-57% of UK premises. The technology has more than 6,500 mobile sites across the UK, up from c.3,000 in 2020 – 87% of these sites are in England, 8% in Scotland, 3% in Wales and 2% in Northern Ireland. Around 20% of sites in urban areas now have 5G deployed on them, compared with around 5% in suburban areas.
Consumer take up of 5G remains relatively modest, but has increased substantially, with around 800,000 active 5G devices across all mobile operator networks in the UK in 2020, rising to more than 6 million handsets in September 2021. For MNOs this represents around 10% of all active devices. At present this is predominantly done via Non-Standalone (NSA) 5G, which harnesses some existing 4G signalling, but faster Standalone (SA) networks are coming.
Although doubling in the last year, 5G traffic still accounts for a relatively small proportion of overall mobile data traffic at 3%, with 4G remaining the dominant technology at 91%. Digging deeper, we were able to find some geographic coverage figures for individual mobile operators across rural vs urban areas.
2021 Geographic UK 4G Coverage by Operator
Otherwise, you can check out the full Connected Nations 2021 report online.
International Comparison
Alongside this report Ofcom has also published their latest international comparison, which pits the United Kingdom’s broadband and mobile connectivity against both the EU’s four major economies (France, Germany, Spain and Italy) and various other large countries. The data on this front is from 2020 and thus the figures are lower than those reported above.
Overall, we still do well for “superfast” coverage, but are near the bottom for full fibre, although that rollout is currently going through a rapid ramping-up phase. We think the FTTH Council Europe’s country ranking (here) shows this difference better than most.
UPDATE 11:43pm
We’ve had a comment from the Government.
Digital Secretary, Nadine Dorries MP, said:
“Ofcom’s report shows we are making major progress on our commitment to deliver a digital infrastructure revolution.
Superfast broadband, almost universally available thanks to our £2 billion investment, allows people to work remotely, video call and stream TV on multiple devices at once with no interruptions.
But no one should miss out on better connectivity. Starting with areas still struggling with slow speeds, we are upgrading the nation with a further £5.5 billion of funding to close gaps in mobile coverage and deliver even faster gigabit broadband in rural areas.”
UPDATE 1:04pm
Openreach has kindly provided a comment too.
Mark Shurmer, Openreach’s MD of Regulatory Affairs, said:
“The building of full fibre to an additional three million homes in a single year is a significant milestone for the UK, and we’re proud to have delivered over three-quarters of that increase. Over eight million (28%) homes now have access to full fibre, but there’s much more to do.
We’re fully focussed on accelerating our own high quality build to four million per year, bringing the country’s most reliable broadband technology to 25m premises and across urban and rural areas in equal measure.
However, there remains around 12 million homes and businesses that could order a better broadband service over our network today. As always, we’d encourage people to check our website and discover what might be on offer in their area.”


Mark is a professional technology writer, IT consultant and computer engineer from Dorset (England), he also founded ISPreview in 1999 and enjoys analysing the latest telecoms and broadband developments. Find me on X (Twitter), Mastodon, Facebook, BlueSky, Threads.net and Linkedin.


« Full Fibre ISP Box Broadband Starts Offering Netgem TV Service


I won’t reproduce my previous rants but this OFCOM data is sketchy at best. If I could get the FTTC and mobile signal in my town they say I can I’d be a lot happier (and not checking this site daily hoping for FTTP). I think i’d be less upset if OFCOM gave some way to let them know when they are wrong but I’ve never found one. They seem to cover themselves with the catch all ‘your speed may vary between providers’ but if no provider can meet that speed it ultimately means nothing.
Ofcom data you can see is showing the top end range estimate that Openreach make. Don’t know if this is the single figure Openreach provide or a choice Ofcom makes. so for VDSL2 this can mean when you look things up estimates are somewhat high.
The thinkbroadband data is using a more pessimistic VDSL2 model and should be close to the low end Openreach estimate. If the search on https://labs.thinkbroadband.com/local/postcode-search is wrong please do drop me an email to have a look and update it. Turn around on updates, be they positive or negative is usually next day.
Thanks for responding Andrew – I’ve reported the slow FTTC to you in my postcode and you’ve updated 🙂 . My complaint is there is no way to do this with OFCOM! To be fair the OFCOM FTTC is within 20%, its more the mobile signal that seems utterly devoid of reality…
yes it is super sketchy and they really don’t care (I raised a complaint before).
Thinkbroadband has me at 6/1 (actually I could get around 7/1 when I used fixed line)
Ofcom…wait for it… 15/1! Completely fictional result, no one in my area can get over 8mb on their current ADSL EOLs, even according to Openreach themselves.
‘There are lies, damn lies and statistics’
The insight I found most astonishing in this of one report was the fact that the U.K. consumer more data per capita on a monthly basis than any other country.
The iPlayer effect. UK takeup of pay TV is pretty low so lots of OTT streaming services being used.
Yipee, I am in the 4% super slow broadband club. Why, because determining coverage by post code for fttc is plain stupid.
A basic understanding of line attenuation would have solved the issue. This is true for urban or rural scenarios.
FTTP ETA 2026 if we are lucky.
Ofcom is using UPRN/Address level data.
Thinkbroadband is full postcode level.
Ofcom uses highest estimate for address
Thinkbroadband uses low end estimate for centre point of postcode. We created a model based on worst case crosstalk and then looked at masses of real world data to create the line length versus speed model some years ago.
This means different methodologies and what both hold for each postcode/address is available and I am happy to look at individuals situations in case we’ve not already handled any specifics in an area.
If Ofcom is showing a wrong speed for FTTC then its data Openreach have given them
@Andrew Ferguson
Its a bit more simple than using UPRN/Address data, OR placed a number of properties on a dslam 1500m away, while the other properties within the same postcode are on a dslam 500m away. Why, no idea as both cables were installed at the time the estate was built, back in the old dial up days. AFAIK the bean counters were informed, but did not rectify the situation. Prior to UPRN often used to see we could get 56Mbs, but when I spoke to the provider (BT) saying will you re provide the line to the closed dslam, NO we don’t move lines to improve a service. So we are in the 4%, it will never get fixed, we are not rural, and we are paying the same price for a sub-standard service as our more fortunate neighbours.
Ok in that case the thinkbroadband data will provide figures for the cabinet the majority are connected to, but it will flag as being a split postcode, i.e. some caution to be taken when using data for the postcode.
For an address (ie. single property) it should be a single cabinet, but we have seen rare cases of 1 address being served by two cabinets when there are two phone lines into a property.
If the Ofcom data is wrong and the Openreach figures are right, then something very odd as Openreach give the data to Ofcom
And heres my area in the 2% that cant even get a reliable 10 meg connection.
Im resorted to using my phones 4g which is spotty at best.
Totnes road paignton.
@Andrew Ferguson
The dslam 1500m away has been ‘improved’, hahaha by adding an upgrade on the side (yes I have seen inside it), and on its associated distribution cabinet, a G-Fast extension. In addition there is a new dslam installed (2021) between the original dslam and the distribution cabinet, which may be adding capacity on the existing bearer cable, yummy, more crosstalk.
The original cabinet feeds multiple postcodes, in both east and west (according to my sources). HuaWei’s documentation states quite clearly that there will be degradation if the line length is greater than 1000m, so in all cases the subscriber must be located less than 1000m line length from the dslam to get a reasonable speed. Unfortunately this appears to not been observed during the rollout within and outside Dankshire
It is normal for a cabinet to feed multiple postcodes, with 85000 or so cabinets and 1.6 million postcodes covered that is to be expected.
As is the speed varying by line line length, and if public money was spent Openreach only got paid for premises where speeds would exceed 24 Mbps once line length was taken into account.
@Andrew Ferguson
Re
As is the speed varying by line line length, and if public money was spent Openreach only got paid for premises where speeds would exceed 24 Mbps once line length was taken into account.
The speed has never exceeded 24Mbs, and I believe various FOI’s to DCMS have confirmed there are many subscribers in the same situation.
And reflected in our figurea hence why ‘fibre’ figures which is vdsl2 or fttp or cable is a biggwr number of premises than superfast 24 or superfast 30 figures