Broadband ISP BT Sees UK Network Traffic Peak at 28Tbps

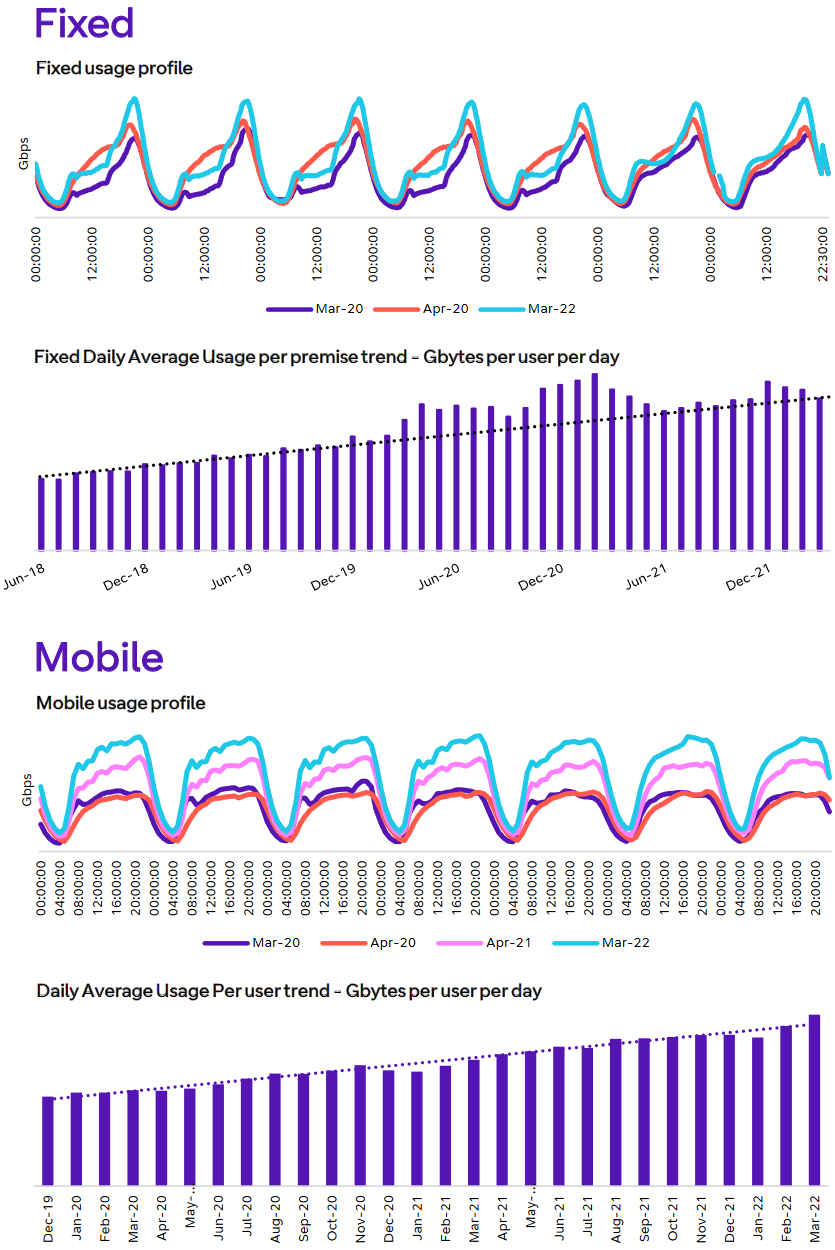
Telecoms giant BT has posted a new update on their current network plans and performance, which among other things reveals that data and internet traffic over their fixed network (broadband and Ethernet) recently hit a new peak of 28Tbps (Terabits per second) during their busiest hour (up from 25Tbps at the end of 2021).
The story for BT’s mobile network (EE) is naturally somewhat less impressive – at least when compared with fixed lines, with the operator reporting a peak of 1Tbps (up from 0.8Tbps a year earlier). But that’s to be expected because most mobile users consume significantly less data than fixed line users (predominantly via Smartphones when outside the house), which is something that Ofcom echoed in its Connection Nations report.
According to the regulator, the average monthly data volume per household on fixed broadband connections increased over the past year to 453 GigaBytes (up from 429GB last year, 315GB in 2019 and 241GB in 2018). By comparison, the average usage per mobile data user was up by 27% last year to 4.5GB per month.
Advertisement
BT also notes that the traffic trends on their network were perhaps forever changed by the COVID-19 pandemic, which saw lots of people being forced to work from home for an extended period. However, despite society having largely returned to something approaching normal, daytime usage remains broadly higher than usual (i.e. home working continues to be popular). Similarly, the evening peak of mobile usage now extends later in the day.
As usual, we should point out that demand for data is constantly rising and broadband connections are forever getting faster, thus new peaks of usage are being set all the time by every ISP. On the flip side, major data capacity links are also getting faster, and the cost of moving data around over long distances has a tendency to come down over time.
In addition, internet providers often adopt sophisticated Content Delivery Networks (CDN) and systems to help manage the load, which caches popular content closer in the network to end-users (i.e. improves performance without adding network strain). This in turn lowers the provider’s impact on external links and helps to keep costs down.
Advertisement
General Network Stats for BT (inc. Openreach, EE)
➤ c.100,000 “fibre cabinets” deployed (predominantly FTTC)
➤ 5,600 exchanges live (inc. 106 metro nodes), although this will be slashed to c. 1,000 exchanges in the years to come as older sites are closed
➤ More than 565,000km of cable duct deployed
➤ 4.6 million telegraph poles built
➤ 20,000 macro cell sites (mobile) built (plus >1500 indoor sites)
➤ 1,000 “digital hubs” deployed (i.e. Street Hubs [Wi-Fi kiosks] – replacing urban payphones)
➤ 18,000 premium Wi-Fi hotspots (inc. 5.6 million via BT’s broadband routers and FON technology)
➤ 20,000 payphones still active


Mark is a professional technology writer, IT consultant and computer engineer from Dorset (England), he also founded ISPreview in 1999 and enjoys analysing the latest telecoms and broadband developments. Find me on X (Twitter), Mastodon, Facebook, BlueSky, Threads.net and Linkedin.


« F&W Networks Get £25m to Expand Full Fibre in South England


Thus, please check this suggests OR ~23.4m users (90%) connected the average peak hour needed per customer is ~1.2Mbps (bits) and average daily usage across users is 1.2GBps (Bytes).
Can anybody else do any better? VM who count their TV where I think reporting the equiv of 17GBps (Bytes) a day per average user.
It demonstrates I believe the limits of using line access speed when measuring end to end user experience. It shows there is much more to come. Does 1GBps a day download now equate to a 1Mbps peak hour capacity per user? What are folk seeing?
I’m not sure I totally follow, however about 5Mbps peak time per subscriber on a ~1000 statistical base, 100-900Mb fttp.
@L That’s in proportion. Tx.
‘Can anybody else do any better?’
Yes. The 28 Tb number is not Openreach so covers a smaller user base. It’s probably the number for BT’s ISPs or the ISPs + the wholesale section of Enterprise.
Yes, this is data for BT and EE the retail providers, not Openreach. Only the network infrastructure stats at the bottom include Openreach.
It must include the traffic generated on Openreach’s access network.
Yes, but only for BT’s part of it, as should be obvious when I say “BT and EE the retail providers” as they only use Openreach. 28Tbps is not even remotely enough to cover all ISPs over Openreach’s network. Just for context, Sky and TalkTalk’s traffic combined would hit around 30Tbps.
‘It must include the traffic generated on Openreach’s access network.’
It’ll be measured at the BRAS that terminate the BT Consumer connections not the Openreach access network. Obviously this means that that traffic has traversed the Openreach access network but doesn’t include the traffic Openreach carry for other ISPs.
The Openreach network carries considerably more traffic than this from such CPs as Sky, TalkTalk, Vodafone, Zen, etc.
I’ve read the original post some more and it doesn’t really make any sense.
‘average daily usage across users is 1.2GBps (Bytes).’
Average daily usage across users is 1.2 Gigabytes per second?
Where did that 1.2 GB/day number come from anyways? Usage hasn’t been that low for years. The article states: ‘According to the regulator, the average monthly data volume per household on fixed broadband connections increased over the past year to 453 GigaBytes’
‘It demonstrates I believe the limits of using line access speed when measuring end to end user experience.’
Most ISPs in the UK have no visible contention at peak times and the UK doesn’t measure with line access speed but throughput.
‘It shows there is much more to come.’
Such as? Where are you measuring this capacity need? Most traffic is served by CDNs and most large ISPs have CDNs either on-net or connected via dark fibre so no need for core bandwidth to match access network bandwidth.
‘Does 1GBps a day download now equate to a 1Mbps peak hour capacity per user?’
No. 1 Gigabyte per second a day doesn’t equate to 1 Mbps peak hour capacity per user. Per Ofcom the average usage is about 15 GB/day and peak hour capacity is, depending on the ISP, as low as 2-3 Mbps and as high as near 10 Mbps. ISPs are at the mercy of their customer base and statistical contention. The larger the customer base the lower the capacity per customer may be, all else being equal, as users smooth out one another’s bursts.
As working from home became more of a thing in 2020 the relationship between peak capacity and usage across a 24 hour period changed as more homes became home offices with people at home using their broadband services.
Sorry, mis-read the monthly data.
1 GByte per second per day is complete nonsense.
Sorry, mis-read monthly.
Umm… One wonders the electricity consumption?
BT covered energy usage during their Network Day presentation on which this article is based
It can be found at https://www.bt.com/about/investors/financial-reporting-and-news/results-events-and-financial-calendar/2022-23
BT expect their energy demand to fall sharply as a result of the shift to FTTP.
I can’t recall the units used but from memory they gave this example for the amount of energy needed per line
DOCSIS 5
FTTC 2.4
FTTP <0.5