Poor Mobile Signal and Notspots Mapped in Nottinghamshire UK

The Nottinghamshire County Council (NCC) in England has published some of the initial results from a project it undertook with Birmingham City University (BCU) and other local authorities, which mapped 4G and 5G mobile (mobile broadband) coverage in the County – helping to reveal areas of both poor and no signal.
The effort began in 2022 after NCC secured £20,000 from the Local Government Association (LGA) to fund its Digital Pathfinders project. Over the 18-month survey period, the project covered 7,723 roads in the districts and boroughs of Nottinghamshire, which needed more than 4,000 hours of driving and this accumulated around 7.7 million data points.
Various not-spots across the County were identified by this process – these are areas which lack sufficient coverage and have a signal strength of less than 125 decibel milliwatts (dBm) coverage. “This means that people in these areas, or those who travel across them, cannot make phone calls, send texts messages, or access the internet through mobile networks reliably,” said the study.
Advertisement
The initial findings from this study have indicated that ‘not spots’ exist in both urban and rural areas, such as Mansfield and Newark-on-Trent. Not spots were more present in rural and semi-rural environments. Interestingly, O2 has the “most promising picture“, with fewer not-spots across both 4G and 5G technologies compared to the other operators. It should be noted that 5G, whilst not as widely present as 4G, still presented not spots and poor signal areas.
By comparison to O2’s positive result, Three UK was found to have the “most not spots or bad coverage areas“. Whilst Three has a good 5G to 4G ratio, it still lacks moderate or excellent coverage in several areas, which can “make deploying use cases which require low latency and reliability difficult“.
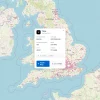
Figure 1: Overall picture of where poor signal and 4G and 5G not-spots are located – red data points signify poor signal, blue signifies not spots

Unfortunately, the initial results lack much in the way of detail, while the visualisations provided are at a very low resolution and adopt the irritatingly vague ‘coloured’ dots approach. This is where a single dot actually covers quite a wide proportional geographic area and thus aren’t much help unless you can zoom-in close to see the correct representation, which you can’t.
Advertisement
The raw data is no doubt much more detailed than this and should produce quite an accurate map, although at present the public doesn’t have access to the full results and so it’s not much use to the rest of us. But no doubt the county council will be able to use this data to help direct future interventions and upgrades, although we’d still like to see the public being given access to all this.
NCC Statement
Nottinghamshire County Council will identify areas in the County that have poor or no mobile connectivity coverage. These areas will be prioritised for interventions and Officers will seek to lobby the MNOs and other partners to drive improved mobile connectivity in Nottinghamshire. We will consider suitable alternatives.
Looking further ahead, the Council will consider other opportunities and look to replicate the mobile connectivity mapping project in the future to maintain and update the data that has been gathered within the County. This will also mean we can track developments and changes in mobile connectivity as 6G is trialled and previous generations of mobile communications (e.g., 3G) become obsolete.
We will also be developing how we map against full fibre and fixed broadband availability so that we can get a complete picture of internet access, total not spots, or extremely slow speeds for use across sensors and mapping.


Mark is a professional technology writer, IT consultant and computer engineer from Dorset (England), he also founded ISPreview in 1999 and enjoys analysing the latest telecoms and broadband developments. Find me on X (Twitter), Mastodon, Facebook, BlueSky, Threads.net and Linkedin.


« Study Shows Impact of Tourism on Mobile Broadband Speeds in Ceredigion


Seems this was just based on signal strength which doesn’t really show an honest picture. In my experience I could have 1 Bar of 4G on Three but 4 Bars of 4G on o2 but Three would still be giving me a better data connection for things like a teams work call.
They give that impression, but the setup they used seems like one that would be able to measure quality/data speeds too. Hopefully they’ll issue more details in the future, as the initial public summary is very limited.
What an utter load of nonsense. If you are on one bar of Three it will inevitably be band 20 which doesn’t actually load anything.
The fanboys just cannot take O2 actually leading in an actual survey. It doesn’t compute.
There are better maps here:
https://observatory.nottinghamshire.gov.uk/transport-and-digital-connectivity/#/view-report/43ff995e6058413db0f8f7cd5776415e/___iaFirstFeature/G3
If you keep clicking through you can eventually get to the link below which is probably as detailed as the data gets.
https://experience.arcgis.com/experience/bfd43dc38ad2458eb29aa5a79fa5b1fe
Thanks for that
That does show the shocking state of 5G in this country
And how it does nothing to help those not already well covered as it duplicates existing high quality coverage, much like fibre rollout being in high quality coverage areas of next best effort
Hello,
Why don’t the Post Office offer their services to map coverage as they visit most houses on a regular basis and the post person could carry a small on person unit or have an in vehicle unit.
It would be great if it was on-person, because this effort essentially maps road coverage rather than house to front door coverage, and while there’s an overlap between the two, front door coverage would be the more accurate for edge cases where this data would be of the most interest & use
Partial not spots plague my part of the country also. It’s not right or fair that overseas visitors get almost perfect coverage because they can roam across all 4 networks, locals on the other hand have to put up with a very second rate service. OFCOM really needs to grow a pair.
So you want to force a carrier to handle traffic from other competing private companies because they invested a built a better network. No way, emergency calls yes but over and above that forget it.
Bringing tourist roaming into the mix is a joke.
If only we had a ‘better built network’ then I would change to it. The SRN scheme was supposed to be resolving this, the S is for share, but it isn’t happening here.