Streetwave Data Casts Doubt on Ofcom’s 4G UK Mobile Coverage Claims UPDATE

Network analyst firm Streetwave, which is harnessing bin lorries to map the coverage and performance of 4G and 5G mobile (broadband) networks across 113 UK councils, has said its data “calls into question” Ofcom’s claim that 88-89% of the UK’s landmass (geographic coverage) can access a 4G network if you look across all operators.
Accurately measuring mobile network coverage and performance is a notoriously difficult task, not least because end-users are always moving through different areas (indoor, outdoor and underground), using different devices with different capabilities and the surrounding environment is ever changeable (weather, trees, buildings etc.). All of this can impact signal quality, and that’s before we consider the differences in network (backhaul) capacity or spectrum allocations between both mast/cell locations and operators.
Ofcom’s data, which is particularly important because the government often uses it as a base for both measuring and setting related policies, is typically based on the estimates of network coverage and performance put out by the mobile operators themselves. This is generated using computer programs that simulate the way mobile signals travel from mobile masts and are blocked by any obstructions such as hills, trees, and buildings.
Advertisement
Many consumers already know, from direct experience, that they should take such figures and related coverage maps (particularly those published on the operators own websites) with a sizeable pinch of salt. In addition, it doesn’t help that Ofcom’s existing coverage predictions are processed into a ‘100 metre by 100 metre’ grid matrix that covers the entire UK land mass.
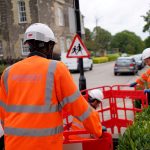
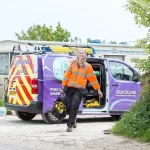
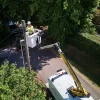
However, Streetwave has been busy pioneering a different approach, which is both more economically viable than other methods of practical real-world data gathering and potentially also much more accurate. The company has spent the past 18-months harnessing refuse (bin) collection trucks to map mobile network coverage and speeds across various parts of the UK (e.g. here, here, here, here and here).
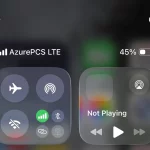
In Streetwave’s setup, refuse trucks are installed with several off-the-shelf Smartphones using special software (pictured), which run continuous network tests – once every 20 metres in rural areas and 5m in urban areas – as the vehicles go around their routes. We’ve already seen some results from this approach and a few hints (here) that the data may call into question Ofcom’s own figures, which, given the different methodologies, is not surprising.
Streetwave’s Findings
The big change today is that Streetwave believes it has now amassed enough data to show that Ofcom’s figures may be quite far off the reality. The company has so far mapped 113 councils across the UK, collecting over 40 million data points. These represent around 37% of the UK’s geography and have around 19 million people living and working in them. The results collected so far are said to show the following “Acceptable Coverage” levels from each of the four major mobile network operators (MNOs), with EE doing the best and Three UK the worst.
Advertisement
Acceptable Coverage by UK Mobile Operator
• EE – 69%
• Vodafone – 61%
• O2 – 50%
• Three UK – 38%
Angus Hay, Streetwave’s CEO, said:
“A collaborative approach is needed to improve mobile connectivity across the UK. This includes continued private and public investment into the networks, as well as local efforts by councils and planning authorities to support infrastructure investments. Our findings raise significant questions around whether there is need for an extension to the Shared Rural Network programme to further support rural communities.”
However, there are some caveats to consider, as Streetwave’s comparison with Ofcom’s figure is not an apples-to-apples one. Firstly, Ofcom’s data covers the whole of the UK, while Streetwave still has a lot of area left to cover and that may yet influence their overall result. The fact that a lot of the geography they’ve reached is in rural Scotland and Wales may be a key factor here that could throw the overall balance off. Time will tell.
The other crucial factor to consider stems from how this is NOT an identical measurement criteria to Ofcom’s 88-89% landmass range for 4G, which is the one that Streetwave calls out in their announcement – this could risk causing some confusion (major newspapers are notorious for overlooking details like this).
For 2G, 3G and 4G networks, Ofcom define coverage based on the minimum signal strength required to at a minimum deliver a 98% probability of making a 90-second voice call successfully. In the case of 4G specifically, Ofcom’s definition also delivers a 95% chance of getting a download speed of at least 2Mbps. This is fairly different from Streetwave’s definition of “Acceptable Coverage” above. You could argue that Streetwave’s definition is better, but it is not the same.
Ofcom are already well aware of the shortcomings in their data and are working to improve it (here). For example, they plan to improve their own coverage checker by adopting higher signal strength thresholds when presenting local predictions, while also assessing predicted signal strength information at a more granular level (50 or 25 square metres, instead of the current 100 square metres) to determine if it is possible to reduce the local uncertainty to some extent.
Advertisement
The regulator is also examining the use of measured data, including crowdsource data, to build on these coverage predictions (this may or may not include Streetwave’s data). Finally, once the regulator’s new coverage checker has launched later in 2025, Ofcom will move to consider undertaking a larger scale performance measurement programme to complement coverage predictions and enhance their mobile reporting.
A spokesperson for Ofcom recently told ISPreview:
“Our current coverage data comes from mobile network operators’ predictions, which we recognise may not always match people’s real-world experience at a very local level. We are working hard to overhaul our mobile coverage checker, which we expect to relaunch later this year with new and improved data to better reflect what people can expect.”
UPDATE 12:16pm
We’ve had a reaction from Mobile UK, which represents the mobile operators.
Mobile UK Statement
“Mobile UK disputes the findings presented by Streetwave. While we acknowledge that all models, including our own, involve predictive elements, Streetwave’s conclusions are based on an extremely limited dataset, derived from just a third of councils across four nations, and are heavily skewed towards rural, low-population density areas. This significantly restricts its applicability to the broader UK mobile landscape.
While we do not agree with these findings it once again puts in sharp focus the need for the Government to better prioritise mobile deployment in its policy making. We look to the upcoming infrastructure strategy as a crucial opportunity to translate this focus into tangible action. Mobile UK’s key asks remain consistent: streamlining planning regulations to expedite network deployment, ensuring equitable access to public land and assets, and fostering investment in digital infrastructure to close the digital divide. We are confident that by addressing these critical areas, the government can create a policy environment that empowers the mobile industry to deliver the world-class connectivity that the UK deserves.”


Mark is a professional technology writer, IT consultant and computer engineer from Dorset (England), he also founded ISPreview in 1999 and enjoys analysing the latest telecoms and broadband developments. Find me on X (Twitter), Mastodon, Facebook, BlueSky, Threads.net and Linkedin.


« Cornwall ISP Wildanet Completes Training of First In-House Engineers
Three UK Business Mobile Customers Top 1 Million Milestone »


It would be great if Streetwave would map the rail routes as well as roads. I’d love to know which operator I should use to maximise the chance of being able to productively work when travelling between Brighton and London!
We have measured rail routs across the River Severn Partnership area.. I know it is not your chosen route, but can be very easily done.
Mobile phone connectivity using the Streetwave solution has been completed across all commercial rail routes within the counties defined by the River Severn Partnership area. This was a real world test from within the train carriage at table or seat height to mimic end user experience.
“Mobile phone connectivity using the Streetwave solution has been completed across all commercial rail routes within the counties defined by the River Severn Partnership area. This was a real world test from within the train carriage at table or seat height to mimic end user experience.”
Let us hope that these findings will lead to tangible improvements in the regulation of the providers and of coverage.
Lets see actual 5G connections with speeds to match….
Three probably wins that one as their 5G is mostly based around 100MHz of n78. That has limited range though, especially indoors.
At last.
The scam that the UK has 98% coverage is a lie and is now being found out to be a lie.
Maybe take a leaf out of warzone apps deployed to mobile users to track drones.
Probably able to lift and shift that app with a bit of customising, to report mobile signal strength and gnss precise position data to an ofcom anonomised database for plotting.
Get out of that one, then, mobile operators.
ISPs a while back were promoting using SamKnows boxes to gather information about the real picture of broadband.
If MNOs are serious about having valid claims of coverage, why are they not promoting OpenSignal or Streetwave style app that customers can install on their phones and provide mapped signal data from millions of data points?