Peak Time Congestion Hits Hardest for Broadband ISP Plusnet
A new study into the impact on broadband ISP download speeds of peak (afternoon) vs off-peak (morning/daytime) internet usage at the largest six broadband providers in the United Kingdom has revealed that Plusnet suffers the biggest proportional drop in performance, while oddly TalkTalk got faster.
Home broadband is somewhat of a “Best Efforts” service, which may sacrifice guaranteed bandwidth and a low contention ratio in order to be more affordable for residential consumers (i.e. network capacity is shared between many users and thus the performance will vary). Naturally this often becomes more noticeable during periods of heavy usage, such as when more people are online and actively using the connection.
Residential broadband connections typically come under most strain in the late afternoon and evening periods (i.e. after work), while business connections are more likely to be impacted during the daytime period (normal working hours). Exceptions can of course occur, such as during school holidays or when a major event (e.g. sport) causes a surge above normal traffic levels (can occur at almost any time of day).
Advertisement
Broadly speaking the impact tends to be fairly small and it’s arguably going to be less noticeable this year because more ISPs will be upgrading their capacity in order to cope with future / faster technologies, such as G.fast and FTTP/H. Nevertheless we have done a bit of new analysis using Thinkbroadband‘s latest Q1 2018 (March) consumer speedtest data for BT, Plusnet, EE, Sky Broadband, TalkTalk and Virgin Media to check.
We should point out that the following are median averages (Megabits per second) that have been extracted from the multi-download (x6) speedtest results. Take note that this may have been impacted by the Easter holidays in late March and it won’t be able to separate business from residential traffic. Off-peak here is defined as Midnight to 5.59am, while Peak reflects 6pm to 11:59pm.
Caution is also advised when looking at upload performance because those are of a lower speed and at this scale it doesn’t take much to produce a big percentage shift one way or the other, even though the actual impact upon end-users will be fairly small.
Average Median Speed Peak vs Off-Peak by ISP (Mbps)
Advertisement
| ISP | Off-Peak Download | Peak Download | DL Difference |
| BT | 35.2 | 33.2 | -5.68% |
| EE | 13.1 | 13.7 | 4.58% |
| Plusnet | 27.90 | 25.70 | -7.89% |
| Sky Broadband | 19.1 | 19.1 | 0.00% |
| TalkTalk | 17 | 19.4 | 14.12% |
| Virgin Media | 82 | 76.7 | -6.46% |
| ISP | Off-Peak Upload | Peak Upload | UL Difference |
| BT | 7 | 6.8 | -2.86% |
| EE | 1 | 2.5 | 150.00% |
| Plusnet | 5 | 4.8 | -4.00% |
| Sky Broadband | 3.7 | 4.1 | 10.81% |
| TalkTalk | 2.7 | 3.3 | 22.22% |
| Virgin Media | 8.8 | 7.3 | -17.05% |
A quick glance across the variable results shows that there’s no particularly obvious / shared pattern, which perhaps isn’t too surprising given all of the aforementioned factors that could affect the outcome. Admittedly Plusnet did suffer the sharpest decline, although from an end-users perspective it’s negligible.
On the flip side TalkTalk actually gained +2.4Mbps (14.12%) of download speed and it’s unclear how that occurred, although such a jump could in theory be caused by a large migration of users to a faster package or an upgrade in overall network capacity (assuming the network was previously suffering from a shortage of capacity).
The results can also be impacted by the proportion of people choosing to test their connections at different times of date, which may help to explain EE’s rather odd result for upload performance (perhaps more of their FTTC base than ADSL2+ were testing during peak periods etc.).
Advertisement
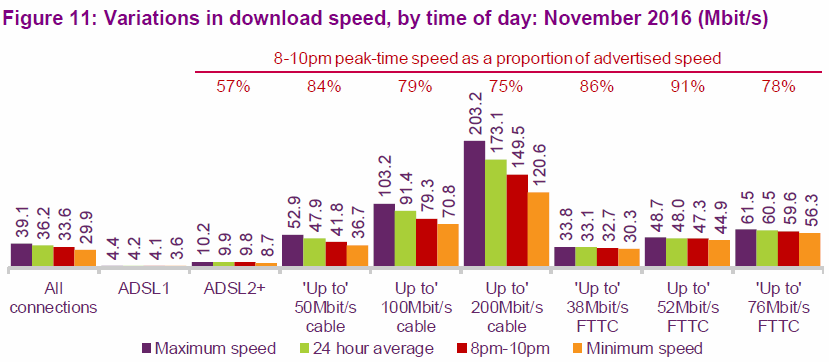
Last year’s fixed broadband speeds report from Ofcom also helped to demonstrate the kind of impact this can have (here), as visualised below across several different times of day and split between ISP packages. This is arguably one of the most accurate representations available, despite suffering from a relatively small sample size (c.2,000 homes).
UPDATE:
Shifted the Ofcom chart to the bottom to reduce confusion.
Mark is a professional technology writer, IT consultant and computer engineer from Dorset (England), he also founded ISPreview in 1999 and enjoys analysing the latest telecoms and broadband developments. Find me on X (Twitter), Mastodon, Facebook, BlueSky, Threads.net and Linkedin.


« 1Gbps Hyperoptic Broadband Coming to Bellway South London Homes


Comments are closed