Spend on UK Home Telecoms Services Falls as Broadband Speeds Rise
Ofcom has today published their annual 2020 Communications Market Report (CMR), which reveals the latest information about the take-up, revenue and impact of fixed line broadband, phone, mobile, TV and radio services across the United Kingdom (England, Scotland, Wales and N.Ireland).
Much of the data in the regulator’s new report tends to summarise information that has already been released, such as via their fixed broadband ISP speeds (here) and connected nations (infrastructure) studies (here). The regulator’s CMR is also quite broad and thus we’ve tightened our focus by summarising only the key broadband, mobile (4G / 5G) and internet connectivity data points (i.e. those that we haven’t covered before).
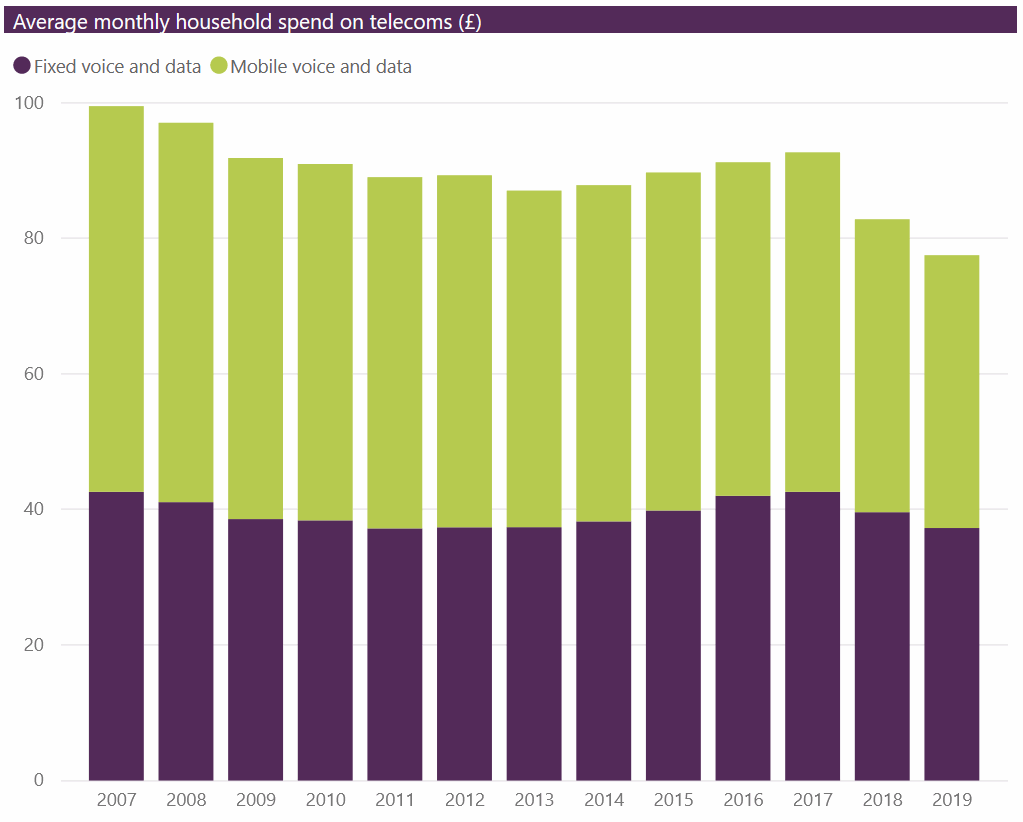
One of the biggest changes this year has been the continuing fall in average UK household spend on telecommunications services (i.e. broadband, phone and mobile). On average, households spent a total of £77.50 per month on telecoms services in 2019, a decrease of 6% since 2018 (£83.56) and equivalent to 3% of the overall average monthly household spend (all services/products etc.).
Advertisement
Furthermore, it’s noted that the UK telecoms sector generated £31.7bn in revenue during 2019, which is sharply down from £33.84bn in 2018 and £36.90bn in 2017. For example, total fixed telecoms revenues fell by £0.6bn (4%) in real terms to £13.4bn in 2019.
Part of the reason for the fall in revenue stems from a decrease in the total volume of outgoing calls from fixed lines, which were down by 17% to 39 billion minutes. By comparison total outgoing mobile call volumes increased by 1% to 162 billion minutes in 2019. Falling prices for fixed broadband ISP and mobile plans are another cause, which is despite internet speeds getting faster and data use rising with every passing year.
Messaging is also moving online as SMS (texts) and MMS (picture messages) use continue to rapidly decline. An average of 68 texts per month were sent from mobile connections in 2019, ten fewer than in 2018. “This is likely to be a result of increased use of online messaging services such as WhatsApp, Facebook Messenger and Instagram,” said Ofcom.
Advertisement
The proportion of households with an internet connection was also 87% in 2020, unchanged for the past three years. Meanwhile some 80% of households have fixed broadband connections (unchanged) and adoption of mobile telephony is close to universal (98%), which is up from 96% last year. In addition, 4% connect via a dedicated Mobile Broadband connection (USB Dongle or Data Card), which is actually down from 5% last year.
Unsurprisingly the old style of pure copper line ADSL based broadband connections now account for just 7.3 million UK connections, which is largely due to being cannibalised by faster FTTC, FTTP and Cable (DOCSIS) services.
Fixed broadband connections by technology (millions)
| 2013 | 2014 | 2015 | 2016 | 2017 | 2018 | 2019 | |
| ADSL | 15.98982 | 15.39154 | 14.39274 | 13.24891 | 11.49298 | 9.550457 | 7.277267 |
| Cable | 4.394293 | 4.541444 | 4.700524 | 4.923828 | 5.109959 | 5.225155 | 5.276566 |
| FTTC | 2.315572 | 3.709993 | 5.441818 | 7.090019 | 9.09648 | 11.26917 | 13.46208 |
| FTTP | 0.03888 | 0.049306 | 0.110029 | 0.191961 | 0.316093 | 0.510807 | 0.783108 |
| Others | 0.018 | 0.018 | 0.018 | 0.018906 | 0.027919 | 0.030525 | 0.028363 |
| Total | 22.75656 | 23.71028 | 24.66311 | 25.47362 | 26.04343 | 26.58611 | 26.82739 |
One other piece of information that wasn’t in Ofcom’s other reports (they seemed to skip it in the Connected Nations study) concerns monthly mobile data (mobile broadband) usage. Overall, the average volume of data consumed per 3G, 4G or 5G mobile user is 3.56GB (GigaBytes), which is up from 2.91GB last year. By comparison fixed line broadband users consumed an average of 315GB per month last year (up from 240GB).
Advertisement
Elsewhere it’s noted that UK internet users on average spend 3 hours 29 minutes using the internet per day. Some 39% of the total time spent online by adults in the UK in September 2019 was spent on Google-owned sites (including YouTube) and Facebook-owned sites (including Instagram and WhatsApp). You can find a lot more data in the full report below.
Ofcom 2020 CMR
https://www.ofcom.org.uk/../cmr-2020


Mark is a professional technology writer, IT consultant and computer engineer from Dorset (England), he also founded ISPreview in 1999 and enjoys analysing the latest telecoms and broadband developments. Find me on X (Twitter), Mastodon, Facebook, BlueSky, Threads.net and Linkedin.


« Q2 2020 Progress Update on Wales BT FTTP Broadband Rollout
Quick Update for Virgin Media Speed Issues on IPv6 Tunnels »


Ofcom continues to focus on connectivity with no regard to line quality or things like anti competitive practices like providers locking down entire new estates.
Frankly I find stats like this pointless labelling “30mbit/s as super fast” is a joke in a fibre network and it’s time someone held up ofcom as the joke they are and instead held them accountable to the consumer.
These sorts of stats show the shortsightedness of the vision of a national network as they attach no criteria to the actual and instead focus on what’s sold which are rarely the same thing.
£31 billion in one year spent on £26 million connections shows a massive gap in actual value, so a drop in spend should be expected or in fact demanded.
I agree completely, they need to ditch the superfast, ultra-fast, mega-fast crap and just be made to say the speed they’re going to provide in 2020, not what they can get away with providing, which is always something completely different.
At first read it doesn’t look good for BT. Despite Plusnet in the no frills arena and EE with the mobile synergy their fixed broadband continues to shrink by 1% per year. It may be offset by some movement to mobile broadband but the data only demand does not appear to reflect that and 2019 data is too early for any USO impact.
More widely with the average fixed broadband spend at £42 per month a good portion must be on the discounted offers (more willing to switch) and ISPs are failing to get them to upgrade. So my view is this may be of more concern to the Altnets regarding ROI. We already had 50% of the premises covered by VM and now apparently over 14% covered by FTTP but if these trends are right it doesn’t look good for the Giga/Symmetrical evangelists as there is unlikely to be many takers in the short term. Yes customers want effective, consistent and reliable speeds but not at any price. In addition many, my daughter amongst them, would rather pay more for their mobile service and cast to the TV etc and use their wifi hotspot for other devices. Those on poor broadband or no alternative probably don’t need convincing but elsewhere providers will have to make their higher products a lot more compelling.
Can’t say I’ve noticed, paying more for broadband and calls, pay more for mobile calls, 3/4G don’t exist, so no difference.
I was actually surprised by the number still on basic ADSL, given the 500% rise in FTTC but only a 50% reduction in adsl over the same period.
Mark you say ‘just 7.3 million’ but thats close to 25%, Does the chart for connections by technology reflect physical provision or actual users ? My line for example is adsl only but I don’t subscribe to a provider.
> I was actually surprised by the number still on basic ADSL, given the 500% rise in FTTC but only a 50% reduction in adsl over the same period.
You can’t really compare percentages like that. If you’re looking at 2013-2019 then FTTC starts from a very small base, whilst ADSL starts from a very large base.
You need to look at the absolute figures. For example, take the last two years:
From 2018 to 2019, ADSL went from 9.550457m to 7.277267m (-2.27m)
From 2018 to 2019, FTTC went from 11.26917m to 13.46208m (+2.19m)
Cable+FTTP+Other combined were +0.32m over the same period
The number of lost ADSL connections almost exactly matches the number of gained FTTC connections. That’s basically all ADSL to FTTC migrations (BT in particular has been pushing this aggressively).
OK i get that, fair point. But only comparing the last two years doesn’t work either, I agree look at absolute numbers
total connections (adsl/fttc)
2013 18M 2019 20.5M
So a gain in total connections of 2.5M connections,
Reduction on adsl 8.5M vs Gain in FTTC 11M. over the whole period
So i think we can assume more people are on the net than there were in 2013 and there will be late joiners on both technologies likely biased towards FTTC as the roll outs progressed.
But still a reduction of only 50% in the number of people on ADSL in the time shown, be that by choice, lack of choice or lack of knowledge/interest/finance, I thought it’d be better. Even adding in the other fixed connections theres still close to 25% on ADSL.
Is there any benefit to FTTC? 10 meters out of Telephone exchange they place a cabinet then hundreds of EO lines are connected to that cabinet some stretching several km away in copper, seems to me a cheap con trick by BT.
There’s a huge benefit to those that see improvement sure. Is it a cheap trick ? Well its cheaper than installing new FTTC cabinets in the optimal position to provide the best possible to the most people, that would likely be hugely expensive and time consuming by comparison.
It’s not just EO lines that lost out, many rural cabinets for example give great connections to the ‘inner circle’ around the old cab and miss out others due to range. Factor in legacy cabling routes too, My line isn’t even connected to the nearest FTTC cabinet, but again the cost in rerouting that to the closer one would be huge.
Budget decisions were made both by private sector and the Government when funding BDUK to write off those that were too expensive, its a bitter pill to swallow when you’re one of them but logical when your aim is to improve the most connections for the least cash.