The Top 2019 vs 2018 Fastest UK Mobile and Home Broadband ISPs

We’re finishing 2019 by taking a look back over the year to see how average broadband ISP download and upload speeds have changed across the top national fixed line and mobile operators. Overall the picture remains one of gradual improvement but the rollout of 5G and “full fibre” (FTTP) will soon change that dynamic.
Service speeds tend to rise for several reasons, with two of the biggest factors reflecting the impact of increased coverage by faster connectivity technologies and their associated take-up by consumers. In that sense Ofcom’s latest coverage data should help to put any performance rises into the correct context. Remember that full fibre networks can generally deliver Gigabit speeds (1000Mbps+).
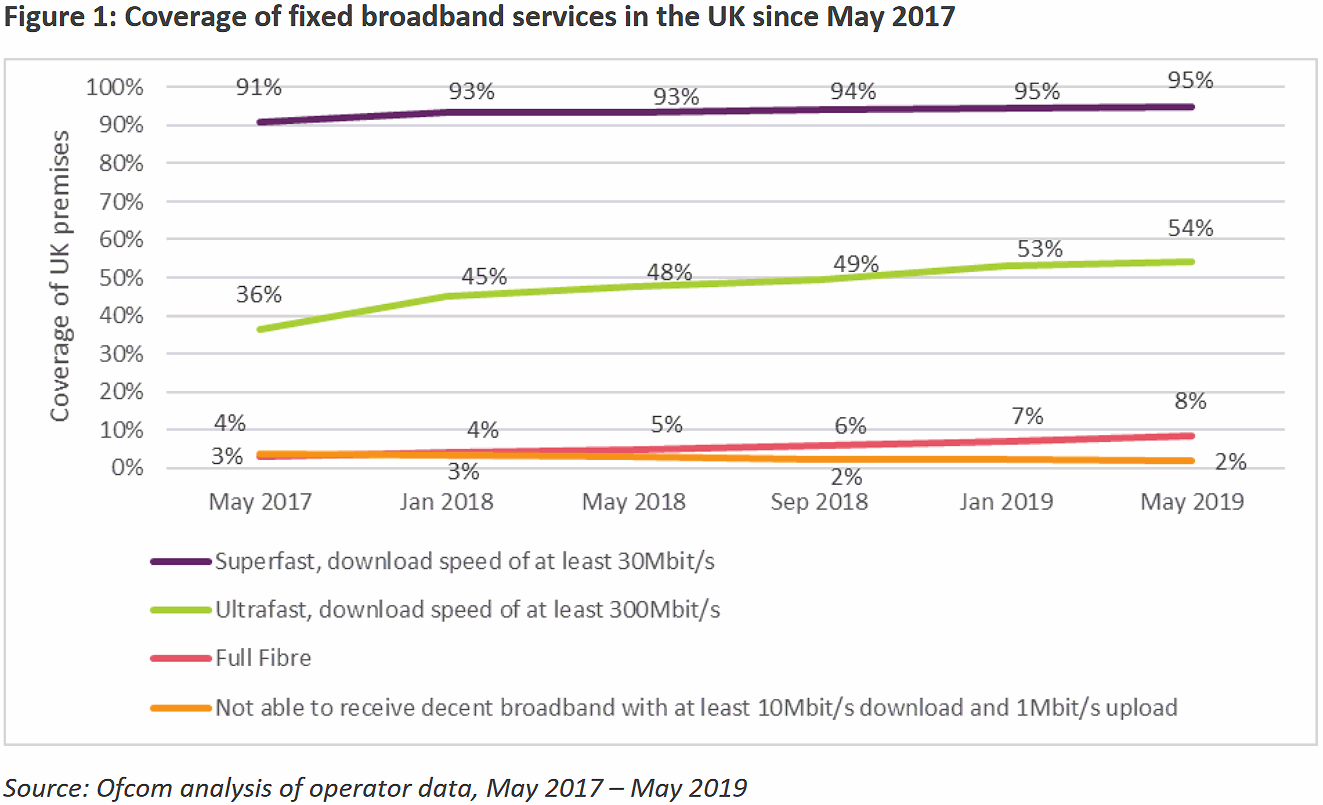
The new generation of 1000Mbps+ (Gigabit) capable “full fibre” (FTTP) networks has clearly seen its coverage rise from 5% of UK premises in May 2018 to around 8% in May 2019, which is an impressive rate of growth but it will take time for this gradually rising take-up and coverage to have a truly significant impact upon speedtest results.
Advertisement
Arguably Virgin’s move to launch a 500Mbps package, as well as the start of their 1Gbps DOCSIS 3.1 technology rollout (here), could have an even more significant impact in the short to medium term. However it’s their recent boost to upload speeds for existing customers that has had the most noticeable impact this time around (more on that later).
Meanwhile 5G mobile has been rolling out since May 2019, although its coverage and take-up remains largely insignificant (i.e. not enough to hugely impact the results). Likewise many early deployments aren’t that much better than the most advanced 4G networks, although this should change as Ofcom releases more spectrum in 2020 and consumers adopt 5G handsets. By comparison 4G has already reached a fairly mature level of coverage.
Fastest Fixed Line Broadband ISPs (H2 2019)
The following data stems from Thinkbroadband‘s independent speedtest database (inc. ISPreview’s Broadband Speedtest) and we’ve only included independent ISPs with strong national availability. We would like to cover smaller alternative network ISPs too but they aren’t yet available to the majority of premises and thus don’t produce much data, but we have still added a few examples of the fastest altnets after the main results.
As usual there are some common caveats to consider with speedtest based results, not least that such scores are naturally more reflective of take-up than network availability. For example, some ISPs may have a much larger proportion of customers on slower pure copper ADSL lines, which can weigh against anybody on faster fibre lines with the same provider (i.e. pushing average speeds down).
Advertisement
Likewise speedtests can easily be affected by all sorts of issues within the home environment, such as slow WiFi, limitations of the tester itself, local network congestion and package choice (an ISP may offer 1Gbps but a lot of people will pick a slower / cheaper plan). As such these scores are really only good for observing general market change over time and MUST NOT be taken as a reflection of provider capability.
Average Download Speeds – Top 9
| No. | Operator | 2019 (Top 10%) | 2018 (Top 10%) | Change % |
| 1. | Virgin Media | 85.6Mbps (193.8Mbps) | 69.4Mbps (142.2Mbps) | 23.34% |
| 2. | Zen Internet | 46.4Mbps (74.4Mbps) | 39.7Mbps (73.4Mbps) | 16.88% |
| 3. | iDNET | 41.2Mbps (70.2Mbps) | 36.5Mbps (70.8Mbps) | 12.88% |
| 4. | Vodafone | 38.2Mbps (67.7Mbps) | 31.5Mbps (58.6Mbps) | 21.27% |
| 5. | BT | 35.1Mbps (66.8Mbps) | 31.1Mbps (63Mbps) | 12.86% |
| 6. | EE | 27.6Mbps (57.4Mbps) | 22.6Mbps (46Mbps) | 22.12% |
| 7. | Sky Broadband | 25.4Mbps (54.4Mbps) | 20.3Mbps (37.1Mbps) | 25.12% |
| 8. | TalkTalk | 24.3Mbps (48.2Mbps) | 19.9Mbps (37.8Mbps) | 22.11% |
| 9. | Plusnet | 24.2Mbps (50.5Mbps) | 23.8Mbps (50.5Mbps) | 1.68% |
| – | AAISP | no data | 55.1Mbps (74.3Mbps) | – |
Average Upload Speeds – Top 9
| No. | Operator | 2019 | 2018 | Change % |
| 1. | Virgin Media | 13.6Mbps | 8Mbps | 70% |
| 2. | Zen Internet | 13Mbps | 11Mbps | 18.18% |
| 3. | iDNET | 10.8Mbps | 8.4Mbps | 28.57% |
| 4. | Vodafone | 10.6Mbps | 7.9Mbps | 34.18% |
| 5. | BT | 8.7Mbps | 7.2Mbps | 20.83% |
| 6. | EE | 6.7Mbps | 5.3Mbps | 26.42% |
| 7. | Sky Broadband | 6.3Mbps | 4.6Mbps | 36.96% |
| 8. | Plusnet (Tied) | 5.7Mbps | 5.2Mbps | 9.62% |
| 9. | TalkTalk (Tied) | 5.7Mbps | 4.5Mbps | 26.67% |
| – | AAISP | no data | 17.8Mbps | – |
Overall the average download speed of the top nine national providers was 38.66Mbps (up from 32.75Mbps at the end of 2018) and the average upload speed hit 9.01Mbps (up from 6.9Mbps). The general trend remains broadly upwards (the lack of data this time around means we’ve had to remove the impact of AAISP from both the 2019 and 2018 averages).
Advertisement
In terms of download performance, most of the annual increases have been fairly normal, although uploads were a different story. On the upstream front we’ve witnessed a huge increase from Virgin Media, as well as big rises via both Sky Broadband and Vodafone. Virgin’s jump is no doubt primarily due to their recent upstream boost for existing customers and perhaps the launched of their 500Mbps tier.
Similarly Sky also upgraded a lot of their existing FTTC customers to a faster tier earlier this year (at no extra cost) and they’ve recently launched a new G.fast based “ultrafast” plan, which probably explains their upstream increase. As for Vodafone, it’s a bit harder to say, but rising uptake via Cityfibre’s FTTH network and the cheapness of their top FTTC plan could be playing a role.
Please flick over to page 2 to see how the fastest alternative network (AltNet) ISPs and mobile operators did.


Mark is a professional technology writer, IT consultant and computer engineer from Dorset (England), he also founded ISPreview in 1999 and enjoys analysing the latest telecoms and broadband developments. Find me on X (Twitter), Mastodon, Facebook, BlueSky, Threads.net and Linkedin.


« Internet Data Traffic Dips at UK ISP TalkTalk for Christmas Day


Comments are closed