Ofcom 2019 Report – Avg. Home Broadband ISP Speeds Hit 54Mbps UPDATE
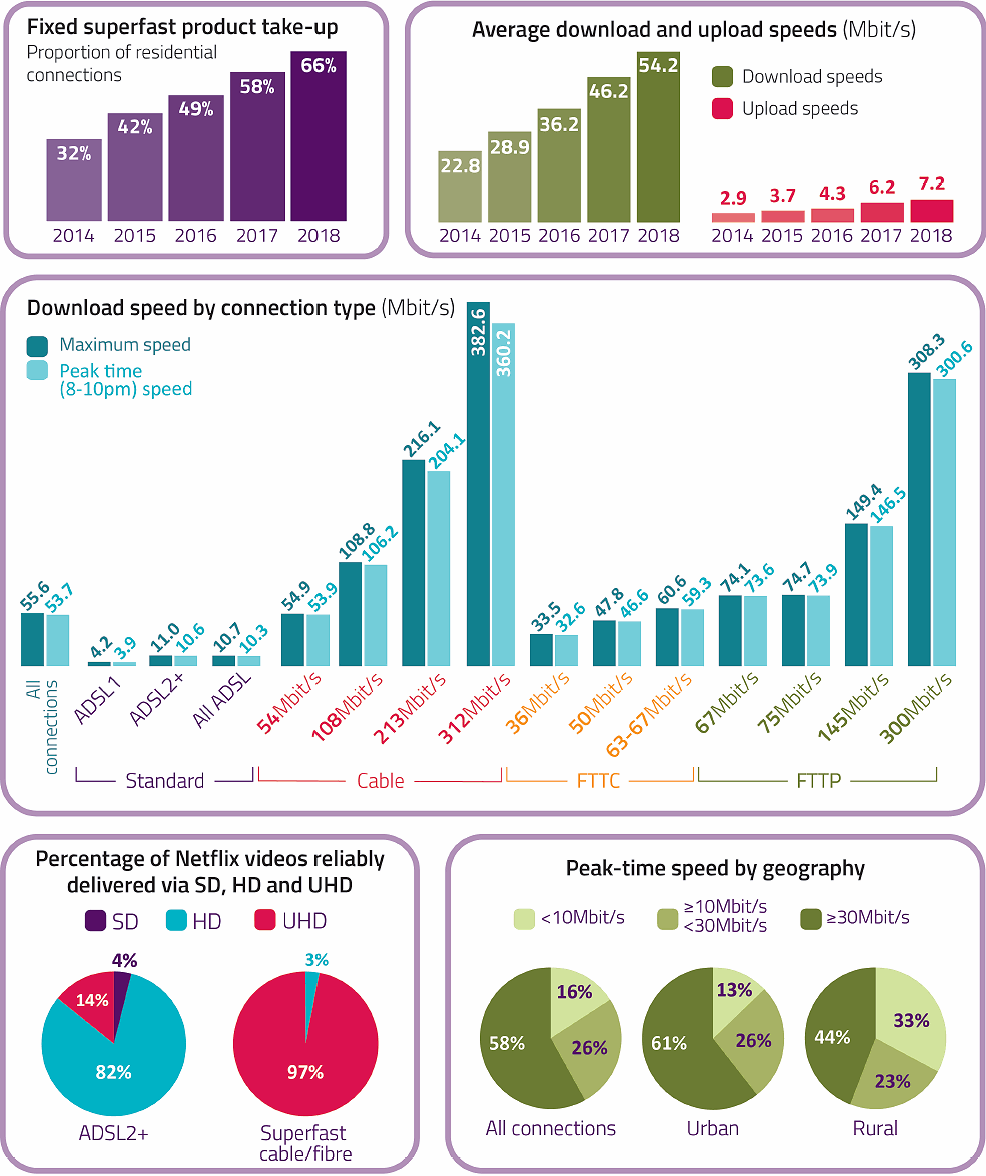
The national UK telecoms regulator has today published their 2019 study of fixed line home broadband ISP speeds, which reports that the average download rate has risen from 46.2Mbps last year to 54.2Mbps now and uploads hit 7.2Mbps (up from 6.2Mbps). But the gap between urban and rural areas has worsened.
Ofcom’s report is based off data gathered during November 2018 via specially modified routers from SamKnows, which were installed in around 4,918 homes (volunteers) across the UK. This method of testing is very accurate but the limited sample size means that their study is only useful for reflecting the general performance of those who subscribe to the largest ISPs (BT, EE, Sky Broadband, KCOM, Plusnet, TalkTalk and Virgin Media).
We must also caveat that speed testing like this should never be directly equated to network availability. At present fixed line “superfast broadband” (24Mbps+) networks are available to around 96% of the United Kingdom, which is mostly via hybrid fibre FTTC (Openreach) or cable EuroDOCSIS (Virgin Media) technology.
Advertisement
A lucky few are also within reach of “ultrafast” connections (Ofcom define this as 300Mbps+ but everybody else tends to use 100Mbps+), which are mostly delivered by Virgin Media’s cable network today (covers over 50% of the UK) but are also spreading rapidly via hybrid fibre G.fast and “full fibre” FTTP services (Ofcom’s Spring 2019 Update). Full fibre covers around 7% of premises.
Average Download Speed (% Annual Improvement)
* May 2019 = 54.2Mbps (+17.32%)
* May 2018 = 46.2Mbps (+27.62%)
* April 2017 = 36.2Mbps (+25.26%)
* March 2016 = 28.9Mbps (+26.75%)
* February 2015 = 22.8Mbps (+21.93%)
* October 2014 = 18.7Mbps (+5.06%)
* April 2014 = 17.8Mbps (+21.09%)
However, despite the wide coverage of superfast services, around 35% of the UK still takes slower and less reliable pure copper ADSL2+ (up to 20Mbps) lines and this will drag the overall results down. The take-up of faster connections should improve over time but some people are also discouraged by issues of cost (faster connections = more expensive), a lack of awareness or personal need and existing contract terms etc.
Luckily the report does a good job of breaking down each connection by technology and package type (they don’t list 1Gbps FTTP plans as none of the big ISPs offer this at scale yet and Virgin’s 500Mbps tier is too recent). On this point we should remind readers that all sorts of things can affect performance. For example, technologies that use copper wire (FTTC, G.fast, ADSL etc.) are often negatively impacted by signal attenuation over distance. Likewise ISP network congestion, traffic management, service faults and poor home wiring can also have an impact.
Advertisement
Sadly there are still some parts of the UK where “superfast” connections have yet to reach (e.g. remote rural and digitally disadvantaged urban pockets in the final 2-3% of premises). At the same time commercial deployments of “ultrafast” networks in urban areas, which have really picked up over the past 2 years, are naturally growing at a faster pace than in rural locations.
The aforementioned combination of factors means there remains a clear disparity of performance between urban and rural areas. Ofcom’s limited data only really considers the two most common rural broadband technologies, hybrid fibre FTTC and pure copper ADSL lines (ADSL lines tend to be longer and less reliable in rural locations than urban ones).
Overall the proportion of lines receiving an average peak-time download speed greater than 30Mbps was lower in rural areas of the UK (44%) than in urban areas (61%), and while 13% of urban lines had a peak-time speed of under 10Mbps, the proportion was 33% in rural areas.
For ADSL connections, the average 24-hour download speed in urban areas (11.9Mbps) was 65% higher than the 7.2Mbps average in rural areas. However, Ofcom noted there is less variation in the length of copper line from the street cabinet to the user’s premises when using FTTC, thus they found that average FTTC download speeds in rural areas (43.8Mbps) were closer to those of urban areas (47.8Mbps).
Advertisement

The Government have of course pledged to extend the reach of “superfast broadband” networks to cover at least 97% of the UK by March 2020 (here) and the new Universal Service Obligation (USO), which sets a minimum download speed of at least 10Mbps for all (here), will from 2020 then aim to improve the performance for those in the final 2%+ “upon request” (i.e. it’s not an automatic upgrade).
In addition, the Government wants Gigabit capable “full fibre” FTTP/H services to cover 10 million premises by 2022, then 15 million by 2025 and it has an aspiration for “nationwide” coverage by 2033 (here). In theory this could resolve concerns over the rural vs urban divide, but assuming that’s even achievable then it’s still a very long way off and in the meantime the divide will remain.
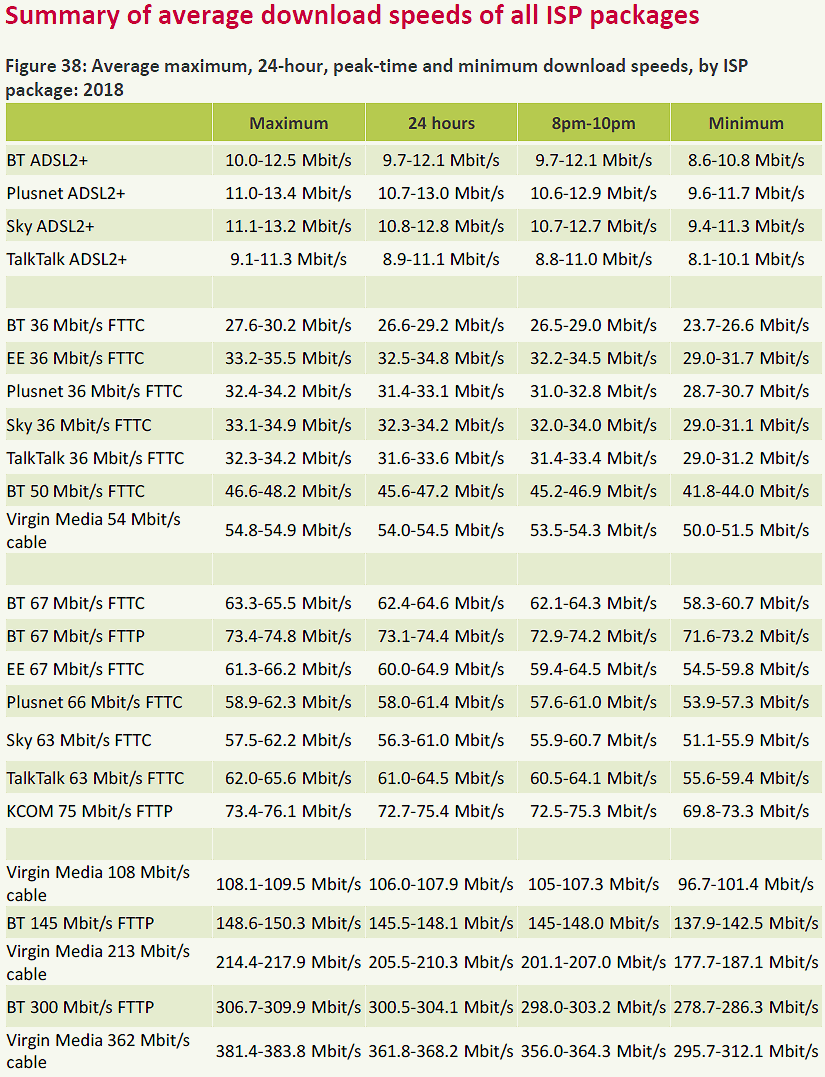
Performance by Technology and ISP
Ofcom’s study also includes a useful breakdown of performance by specific broadband packages and ISPs, all during different periods of the day, which produces some interesting results. As usual the old copper line ADSL2+ connections struggle to reach double figures, while Virgin Media’s cable network does a reasonably good job of delivering on its promised performance.
Last year’s move to adopt average speeds into the advertising of related packages has clearly had an impact upon how the results are presented, with both the slower and faster FTTC tiers now appearing more able to deliver upon what they promise. However it’s worth considering that the maximum theoretical FTTC download speeds are still 40Mbps and 80Mbps (two primary tiers).
For the first time, Ofcom has also been able to include FTTP packages in their research, and this report includes data for three related BT packages and one KCOM service. Perhaps unsurprisingly the regulator found that BT’s 67Mbps FTTP package outperformed the same FTTC tier to a “95% level of significance for all the metrics for which comparable figures were available.”
Unfortunately this is also one other area where the limited sample size of Ofcom’s report means we don’t get to see any results from superior FTTP/H connections from smaller alternative network ISPs, while the take-up of new hybrid fibre G.fast is still too small to be included.
Latency
The regulator also includes some results from their study of latency performance, which is a useful measure of the time (delay in milliseconds [1000ms = 1 second]) that it takes for a packet of data to travel from your router to a remote server and then back again (ping). Jitter and packet loss are also covered but latency is the more familiar measure and we’ll focus upon that below.
A lower number (shortest time = faster) here is better and this is particularly important for fans of online multiplayer games, where a low ping can result in smoother gameplay. Generally most modern connections should deliver good latency performance, unless there’s a problem within the providers own network, your local network setup or a remote internet server etc.

Overall there’s not a lot of appreciable difference between the ISPs and everybody should be fairly happy with the performance. Even the older ADSL2+ services manage to deliver 30ms or less, although there is a reasonable improvement to be found when adopting one of the faster connections. Meanwhile FTTC and Cable lines seemed to deliver around 10-20ms, while FTTP was top with stable latency of around 5-10ms.
Ofcom also examined the related measure of Packet Loss (i.e. how much data goes missing during transmission, which the connection must then automatically correct) and too much of this can result in higher latency. The good news is that during normal operation the ISPs displayed Packet Loss of around 0.1% to 0.2%, although Virgin Media’s 50Mbps plan did have an issue. In any case this isn’t something that most people should worry about.
Tackling Speed Problems
Sometimes your speed may fall well below expectations and this is supported via Ofcom’s Voluntary Code of Practice for Broadband Speeds, which requires member ISPs to provide reliable estimates of connection performance during the order process and to also help resolve problems when they arise.
In March 2019 a revised code was introduced (details), which provides more information during sign-up and strengthens the right to exit when speeds fall below the guaranteed minimum level. Providers are now given 1 month to resolve the problem and if they fail to do so then customers can walk away, penalty-free (the right to exit also applies to contracts that include phone and TV services purchased with broadband in a bundle).
Furthermore, the code has been expanded to include Cable (e.g. Virgin Media) and “full fibre” (FTTP) providers, although the minimum guaranteed speed level for such ISPs is measured differently because these services aren’t affected by the same issues. Instead Ofcom said that the minimum guaranteed download speed should be at least 50% of the advertised speed of the package, rather than 10% for other connection types.
The code is voluntary and many smaller ISPs find that the approach or costs involved with adapting to the rules can be too challenging, which means many won’t sign-up.
Ofcom Fixed Home Broadband Speeds Report 2019
https://www.ofcom.org.uk/home-broadband-performance-2019
UPDATE 6th June 2019
After some badgering Ofcom has now finally confirmed some useful figures that were left off the original report. The research shows that average download speeds in rural areas (28.0 Mbit/s) were less than half those in urban areas (62.9 Mbit/s).
Mark is a professional technology writer, IT consultant and computer engineer from Dorset (England), he also founded ISPreview in 1999 and enjoys analysing the latest telecoms and broadband developments. Find me on X (Twitter), Mastodon, Facebook, BlueSky, Threads.net and Linkedin.


« Tesco’s UK Mobile Network Loses 4G Data Connectivity UPDATE


Comments are closed