H1 2020 BDUK Take-up Data – UK Superfast Broadband Rollout
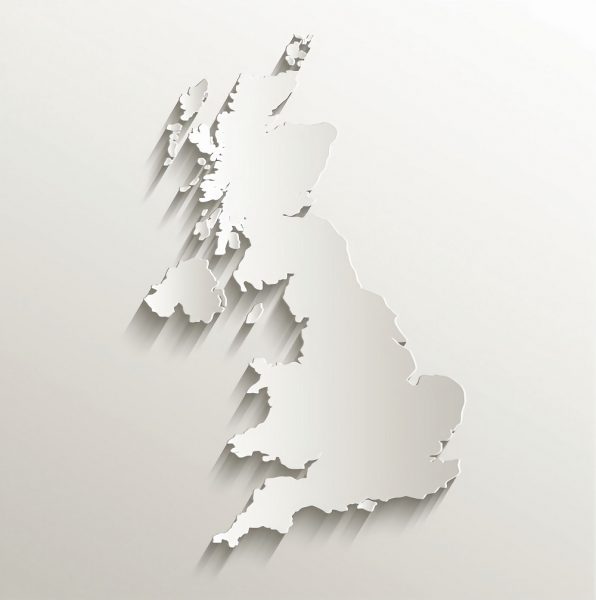
The Government’s £1.8bn Building Digital UK project has now helped to extend “superfast broadband” (24-30Mbps+) ISP networks to 5,293,139 extra premises since 2012 (up by 62,665 over the past 6 months) – about 390,000 of these are FTTP – and the latest take-up data to June 2020 reveals strong demand.
The following figures reflect the percentage % of premises (homes and businesses) that have chosen to take a 24Mbps+ capable service (usually via FTTC, FTTP or Fixed Wireless Access technology), albeit specifically those which have been delivered via state aid support under the BDUK programme (i.e. % subscribed of premises passed).
The data is split between the first two phases of the programme. The most recent contracts have tended to focus on remote rural areas, which since around 2018 have increasingly involved deployments of “full fibre” (FTTP) broadband technology to reflect the Government’s changing focus toward “gigabit-capable” services. Prior to that hybrid fibre FTTC (VDSL2) was the most common technology.
Advertisement
We should add that older BDUK contracts defined “superfast” as offering download speeds of 24Mbps+, while recent ones have increased this to 30Mbps+ (this aligns with the definition used by Ofcom and the EU).
BDUK Phases One (Finished Spring 2016)
Supported by £530m of public money via the Government (mostly extracted from a small slice of the BBC TV Licence fee), as well as significant match funding from local authorities and the EU. The public funding is then roughly matched by BT’s private investment. Overall it helped to extend “superfast broadband” (24Mbps+) services to cover 90% of premises in the United Kingdom.
BDUK Phase Two (Technically on-going)
Supported by £250m of public money via the Government, as well as match funding from local authorities, Local Growth Deals and private investment from suppliers (e.g. BT, Gigaclear, Airband, Call Flow etc.). This phase extended superfast broadband services to 95% of premises in time for the end of 2017, but some newer contracts are on-going (e.g. the Welsh Government’s new programme).
Most of these contracts also include a clawback (gainshare) clause, which requires the suppliers to return part of the public investment as customer adoption of the new service rises. The funding from this is being reinvested to further improve network coverage and speeds via extension contracts. Efficiency savings from earlier contracts can also be reinvested, but sadly we don’t have any recent data on that (we think it could be worth c.£300m).
So far it looks as if a total of around £788m could in theory be returned via clawback from BT (here) and a fair amount of that has already been returned. BDUK has previously estimated that this reinvestment might be enough to help boost the UK coverage of 24Mbps+ capable networks to beyond 97% (we’re at about that level now), but this is NOT an official target.

Advertisement
The Universal Service Obligation (USO) mentioned above is a reference to the Government’s new legally-binding pledge to ensure that those in the final c.2-3% of premises, which may not benefit from BDUK’s effort, can still request a download speed of at least 10Mbps (details here). Sadly Ofcom’s move to accept 4G as a solution for most of this gap feels like a bit of damp squib due to the technology’s variable nature.
BDUK Phase One Take-up (Average %)
The following tables break the take-up data down by each BDUK local authority (project area) and devolved region (Scotland, Wales etc.), although for the proper context these percentages should ideally be considered alongside the most recent premises passed (network coverage) data, which can be seen at the bottom of this article. Overall 69.24% of premises have adopted the new service (up from 62.66% in H2 2019).
NOTE: Some of the counties have divided their deployments into separate contracts. For example, Phase One in Shropshire doesn’t include the ‘Telford and Wrekin‘ area because that is part of a separate Phase Two contract inside the same county. On top of that the contracts were all signed at different times and so are at different stages of development.
| Project Area (BDUK Phase 1) | Uptake % (Dec 2019) | Uptake % (Jun 2020) |
| Berkshire Councils | 68.61 | 76.76 |
| Buckinghamshire and Hertfordshire | 72.11 | 72.56 |
| Cambridgeshire, Peterborough | 65.54 | 77.56 |
| Central Beds, Bedford Borough, Milton Keynes | 70.91 | 69.21 |
| Cheshire East, Cheshire West & Chester, Warrington, Halton | 68.31 | 73.65 |
| Devon & Somerset (including, Plymouth, Torbay, North Somerset, Bath & NE Somerset) | 63.61 | 69.33 |
| Coventry, Solihull, Warwickshire | 70.27 | 67.76 |
| Cumbria | 64.48 | 68.86 |
| Derbyshire | 62.85 | 68.59 |
| Dorset, Bournemouth and Poole | 63.85 | 67.8 |
| Durham, Gateshead, Tees Valley and Sunderland | 63.01 | 71.79 |
| East Riding of Yorkshire | 66.6 | 73.99 |
| East Sussex, Brighton and Hove | 68.81 | 73.14 |
| Essex, Southend-On-Sea, Thurrock | 68.5 | 64.55 |
| Greater Manchester | 60.22 | 70.97 |
| Hampshire | 66.08 | 68.52 |
| Herefordshire and Gloucestershire | 63.13 | 72.23 |
| Isle of Wight | 61.73 | 65.95 |
| Kent and Medway | 66.99 | 71.75 |
| Lancashire, Blackpool, Blackburn with Darwen | 60.89 | 71.35 |
| Leicestershire | 67.33 | 63.54 |
| Lincolnshire | 66.44 | 65.67 |
| Merseyside | 57.74 | 72.21 |
| Newcastle upon Tyne | 59.5 | 68.98 |
| Norfolk | 66.78 | 69.8 |
| North Lincolnshire, North East Lincolnshire | 65.44 | 74.7 |
| North Yorkshire | 58.21 | 71.57 |
| Northamptonshire | 69.5 | 70.12 |
| Northumberland | 65.82 | 72.47 |
| Nottinghamshire | 65.9 | 75.13 |
| Oxfordshire | 68.43 | 70.17 |
| Rutland | 69.86 | 71.72 |
| Shropshire | 64.84 | 68.11 |
| Staffordshire and Stoke-on-Trent | 63.62 | 72.36 |
| Suffolk | 67.59 | 73.52 |
| Surrey | 70.02 | 75.63 |
| West Sussex | 68.92 | 74.87 |
| West Yorkshire | 62.11 | 66.4 |
| Wiltshire | 67.79 | 72.28 |
| South Gloucestershire | 68.93 | 74.37 |
| Worcestershire | 68.77 | 67.17 |
| Devolved Administrations | ||
| Highlands and Islands | 63.85 | 69.15 |
| Northern Ireland | 69.2 | 72.84 |
| Rest of Scotland | 59.8 | 64.56 |
| Wales | 51.77 | 64.82 |
BDUK Phase Two Take-up (Average %)
So far in this phase an overall total of 48.54% of premises have adopted the new service, although some projects have yet to report. We note that a number of Phase 2 schemes also consist of more than one contract and so you may see several figures being reported for certain areas in order to reflect each of those deals (this is sadly very confusing but that’s just how they do it).
Advertisement
Both of the recent contracts in Scotland and Wales will also be covered in this table because they have received some funding from the original BDUK programme.
| Project Area (BDUK Phase 2) | Uptake % (Dec 2019) | Uptake % (Jun 2020) |
| Bedfordshire & Milton Keynes | 56.27 | 61.87, 9.7, 8.85 |
| Berkshire | 27.66, 5.62, 35.01, 2.17 | 31.49, 9.03, 40.38, 7.89 |
| Black Country | 51.74 | 57.46 |
| Buckinghamshire | no data | 0 |
| Bucks & Herts | 52.06 | 58.42 |
| Cambridgeshire | no data | 3.29 |
| Cheshire | 58.31 | 63.85 |
| Cornwall | 55.88, 34.07 | 60.61, 33.28 |
| Cumbria | 49.32 | 54.46 |
| Derbyshire | 40.66 | 45.91 |
| Devon & Somerset | 10.13, 9.85 | 8.31, 11.49 |
| Dorset | 62.64, 16.05 | 67.81, 23.3 |
| Durham | 53.51 | 59.44 |
| East Riding (Yorkshire) | 60.7 | 65.76 |
| East Sussex | 61.95, 7.42 | 67.83, 8.47 |
| Essex | 56.03, 26.61, 5.82, 21.68, 1.9, 13.37, 3.91, 2.28 | 63.55, 26.61, 5.82, 21.78, 1.9, 13.37, 0, 3.91, 2.28, 0, 0, 0 |
| Greater Manchester | no data | no data |
| Hampshire | 51.38 | 58.55 |
| Herefordshire & Gloucestershire | 37.42, 12.04, 12.38, 8.53, 6.14, 26.14, 41.84 | 37.42, 12.04, 12.38, 8.53, 6.14, 26.14, 41.84 |
| Hertfordshire | no data | no data |
| Kent | 65.23 | 73.56 |
| Lancashire | 47.71 | 53.12 |
| Leicestershire | 52.45 | 58.21 |
| Lincolnshire | 50.08 | 55.7 |
| Norfolk | 56.33 | 61.65 |
| North Lincolnshire | 52.71 | 58.17 |
| North Yorkshire | 56.36, 19.56 | 56.36, 24.27 |
| Northamptonshire | 58.96, 11.85, 10.8 | 58.96, 11.84, 10.8 |
| Northumberland | 50.77 | 50.77 |
| Nottinghamshire | 50.42, 49.95 | 50.42, 49.95 |
| Oxfordshire | 5.68 | no data |
| Rutland | no data | no data |
| Shropshire | 57.13, 1.58 | 65.64, 6.52 |
| South Gloucestershire | 58.95, 20.75 | 63, 25.31 |
| South Yorkshire | 53.16, 3.08 | 59.33, 7.66 |
| Staffordshire | 51.12 | 56.19 |
| Suffolk | 57.18 | 62.47 |
| Swindon | 8.68 | 8.68 |
| Telford & Wrekin | 64.46 | 71.86 |
| Warwickshire | 55.49, 10.39 | 62.78, 14.58 |
| West Oxfordshire | 11.64 | 14.1 |
| West Sussex | 58.67 | 65.96 |
| West Yorkshire | 48.21 | 53.68 |
| Wiltshire | 54.8, 7.54, 21.52 | 59.91, 9.78, 34.03 |
| Worcestershire | 55.43, 20.13 | 61.8, 19.17 |
| Devolved Administrations | ||
| Highlands and Islands | no data | no data |
| Northern Ireland | 50.77 | 50.77 |
| Rest of Scotland | no data | no data |
| Wales | 2.73, 2.58, 2.59 | 2.73, 2.58, 2.59 |
IMPORTANT: Take-up is a dynamically scaled measurement, which means that at certain stages of the scheme it may go up or even down depending upon the pace of deployment (i.e. premises passed in any given time-scale), although over time the take-up should only rise.
Explained another way, earlier phases of the roll-out were easier and faster to deploy, so you could expect to see a bit of a yo-yo movement with the take-up % sometimes falling if lots of new areas were suddenly covered. Some contracts are also younger than others and will thus take time to catch-up. On top of that BDUK’s roll-out pace has slowed to a crawl as it reaches remote rural areas, which will give take-up a chance to climb.
A number of other factors can also impact take-up, such as the higher prices for related “fibre” services, as well as customers being locked into long contracts with their existing ISP (they can’t upgrade immediately) and a lack of general awareness (locals don’t always know that the faster service exists) or interest in the new connectivity (if you have a decent ADSL2+ speed and only basic needs then you might feel less inclined to upgrade).
The fear of switching to a different ISP may also obstruct some services. In other cases the new service may run out of capacity (i.e. demand is higher than expected), which means that people who want to upgrade are prevented from doing so until Openreach resolves the problem, although the scale of this issue is fairly small.
Now, for some context, here’s the latest progress report on related contracts for the same period (this doesn’t show any match-funding from private investment). Take note that this also appears to have included some output from the latest R100 programme in Scotland (listed under ‘Scottish Government‘).
Funding and Premises Passed Progress (BDUK Phase 1 + 2)
| Total BDUK Contracted Funding | Total LB Contracted Funding | Current Total Contracted premises | Delivered to Date (June 2020) | |
| Bedford & Milton Keynes | £8,130,000 | £9,443,694 | 52,526 | 52,118 |
| Berkshire | £5,153,017 | £4,603,250 | 41,187 | 33,987 |
| Black Country | £2,988,349 | £2,988,349 | 37,302 | 37,389 |
| Buckinghamshire | £0 | £1,767,716 | 755 | 0 |
| Bucks & Herts | £10,837,000 | £11,415,000 | 92,880 | 91,535 |
| Cambridgeshire | £8,250,000 | £21,895,592 | 112,148 | 106,080 |
| Cheshire | £6,461,000 | £16,091,055 | 82,039 | 82,210 |
| Cornwall | £5,960,000 | £13,631,224 | 14,988 | 15,109 |
| Cumbria | £19,959,519 | £18,136,384 | 121,780 | 121,708 |
| Derbyshire | £9,579,550 | £9,580,000 | 103,046 | 100,213 |
| Devon & Somerset | £40,029,305 | £30,317,110 | 305,308 | 299,817 |
| Dorset | £13,741,841 | £16,051,546 | 81,532 | 78,857 |
| Durham | £13,189,267 | £12,166,000 | 115,790 | 113,031 |
| East Riding (Yorkshire) | £10,507,459 | £8,393,079 | 51,661 | 49,753 |
| East Sussex | £13,640,000 | £13,000,000 | 68,379 | 64,607 |
| Essex | £14,254,755 | £19,296,658 | 156,377 | 140,614 |
| Greater Manchester | £3,440,000 | £5,923,000 | 41,363 | 40,062 |
| Hampshire | £15,262,307 | £14,261,230 | 110,498 | 102,113 |
| Herefordshire & Gloucestershire | £31,090,658 | £34,512,090 | 161,440 | 135,920 |
| Hertfordshire | £0 | £879,471 | 546 | 0 |
| Highlands & Islands | £50,830,000 | £75,600,000 | 152,700 | 152,635 |
| Isle of Wight | £2,490,000 | £2,490,000 | 17,617 | 17,649 |
| Kent | £17,063,509 | £14,998,391 | 144,131 | 138,921 |
| Lancashire | £14,670,000 | £22,540,000 | 147,334 | 145,803 |
| Leicestershire | £7,968,895 | £10,884,318 | 75,149 | 73,075 |
| Lincolnshire | £16,110,000 | £17,910,000 | 135,710 | 136,086 |
| Merseyside | £5,460,000 | £2,798,448 | 43,905 | 43,966 |
| Newcastle | £970,000 | £941,158 | 6,760 | 6,697 |
| Norfolk | £24,650,000 | £26,153,767 | 213,716 | 204,630 |
| North Lincolnshire | £4,181,007 | £2,880,963 | 31,251 | 29,344 |
| North Yorkshire | £28,160,000 | £25,804,726 | 175,283 | 172,486 |
| Northamptonshire | £9,856,669 | £13,009,000 | 80,019 | 76,476 |
| Northern Ireland | £11,454,000 | £21,954,000 | 66,907 | 67,173 |
| Northumberland | £10,687,867 | £12,047,087 | 49,620 | 49,361 |
| Nottinghamshire | £7,850,000 | £10,288,644 | 69,316 | 68,492 |
| Oxfordshire | £8,184,500 | £20,045,470 | 79,103 | 78,873 |
| Rest of Scotland | £50,000,000 | £107,575,000 | 587,362 | 590,432 |
| Rutland | £1,000,000 | £1,670,000 | 7,175 | 9,903 |
| Scottish Government | £20,990,000 | £187,387,983 | 52,956 | 0 |
| Shropshire | £19,317,466 | £12,722,000 | 68,923 | 67,253 |
| South Gloucestershire | £3,370,000 | £3,521,123 | 19,802 | 20,068 |
| South Yorkshire | £10,395,000 | £13,353,577 | 103,290 | 98,348 |
| Staffordshire | £9,620,000 | £7,587,242 | 80,725 | 81,078 |
| Suffolk | £26,940,000 | £28,304,629 | 131,832 | 125,131 |
| Surrey | £1,310,000 | £19,020,081 | 79,193 | 78,763 |
| Swindon | £950,000 | £950,000 | 20,159 | 17,010 |
| Telford & Wrekin | £2,157,000 | £1,843,000 | 8,653 | 8,698 |
| Wales | £69,040,000 | £210,589,237 | 754,921 | 710,237 |
| Warwickshire | £14,557,172 | £14,557,172 | 73,940 | 63,775 |
| West Oxfordshire | £1,600,000 | £1,556,675 | 4,788 | 3,704 |
| West Sussex | £8,011,243 | £7,510,000 | 53,771 | 54,229 |
| West Yorkshire | £11,019,827 | £18,024,540 | 100,368 | 98,286 |
| Wiltshire | £9,270,000 | £16,496,000 | 82,048 | 76,779 |
| Worcestershire | £8,387,032 | £11,403,641 | 63,830 | 62,655 |
| £720,995,214 | £1,208,770,320 | 5,533,802 | 5,293,139 |
The above figures only include 24Mbps+ capable premises in BDUK intervention areas.
Mark is a professional technology writer, IT consultant and computer engineer from Dorset (England), he also founded ISPreview in 1999 and enjoys analysing the latest telecoms and broadband developments. Find me on X (Twitter), Mastodon, Facebook, BlueSky, Threads.net and Linkedin.
« PC Pro Award Zen and Tesco Best for UK Broadband and Mobile












It can get better and better if you allow yourself to challenge the statement that ‘a fair amount of £788m’ has been handed back. If it has where is it and how much has been invested in the network.
I would argue if gap funding is working and the Capital Deferral is just clawback(probably not but the PR says so) then more is due and it is simple to illustrate why using a cluster of phase 1 cabinets of 200 premises each.
Premises 1,000 (200 premises per cab)
Cost of 5 cabinets (phase1) £125,000 (see BT CMS inquiry submission 2016)
BDUK/LA Budget to bill against – £244,000 (£1.1bn /4.5m est.phase 1 premises and budget x1000)
BT contribution to allowable costs – £85,000 (£85 x 1000 estimate – gap funding model)
BT clawback per 1,000 £143,000 (£788m clawback/5.5m premises x 1000)
Theoretical Profit for BDUK
from 5 urban Phase 1 cabinets- £103,000 (£85+£143k – £125,000)
It would be interesting to see how many of ~25,000 phase 1 cabs delivered profit for BDUK.
The greater the urban shift in Phase 1 the more profit available to keep going towards 99%. No account has been taken of the 1.1m overbuild of VM and how this is reconciled.
An 8th inquiry is needed to confirm how the Capital Deferral will be used to get to 99% coverage. Questions on this matter were batted away by BDUK/BT at the EFRA select committee inquiries in 2017 and 2019.
@NGA – how would you expect VM overbuild to be reconciled? How many cabinets overbuilt and what were the typical percentages of the cabinet areas?
@NGA – and now we have companies overbuilding BDUK funded areas. If only they had done it 5 years ago.
@facts . about £85m is needed from BT where the state overbuilt VM instead of subsidising rural. We can clawback!
@facts They can overbuild BDUK all they want as long as BDUK collect the capital and the clawback and re-invest to complete rural.
What should be blocked is the capitalisation of the BT Capital Deferral ( thus permitting cost recovery) where that money is not invested in the network.
Given BT allegedly never billed for the premises passed by VM I’m not sure where the £85 million number comes from.
Did BDUK overbuild nearly a million VM premises? More than 1 in 14 of the entire VM network?
That seems unlikely.
@NGA – what you describe as VM overbuild was simply a result of enabling cabinets that covered both properties not covered by VM and those that were. Again what do you propose and what are the numbers I asked for?
Carl T – Thinkbroadband reported it so it must be true. https://www.ispreview.co.uk/index.php/2017/10/broadband-delivery-uk-1-million-virgin-media-premises-overbuild.html
I think you will find the cabinets were billed for in full. There are easy to find.
@Facts you have Think Broadband numbers quantifying the problem, and applying a unit cost of investment consistent with Ofcom’s WLA models for FTTC estimates the investment owed.
It is not hard. The clawback can be picked up by including all premises covered in the post code. It does not much to check.
@NGA
That is a long post essentially peddling many of the points you’ve made many times previously and which have been shown to be incorrect. You appear intent on disregarding a key element of the contracts which is that any monies owed once the target coverage has been met will go to the local authorities. It will be up to them to decide how it is spent, so to claim that there is a mythical pot of money to be invested on a few hundred thousand other premises spread around the country is wrong.
Based on Mark’s helpful table, there are approximately 240,000 premises still to be covered by various providers under contract. Once these are completed the local authorities will need to decide how to spend any outstanding funds, including the gainshare money which they will have access to relatively soon. They will of course want to spend it within their own areas and I can see many deciding to prioritise non-broadband investments given how much their budgets are under strain just now.
@NGA
In your reply to CarlT you state “I think you will find the cabinets were billed for in full. There are easy to find.” This is surprising as the article you’ve linked to clearly says the opposite, with the quote from BDUK stating “if there is overspill to other premises then these are not eligible for subsidy, and they are not counted towards the contractual superfast delivery targets. However, these premises are included in the gainshare calculation, so we benefit from any additional take-up resulting from them.”
So it appears that there is no cost to the public purse as no subsidy is paid, however there is benefit from any subsequent gainshare. This seems like a great deal for the tax payer, why do you think that these cabinets were “billed in full”? Do you have any evidence of this? What do you know that the DBUK team don’t?
New-LOndoner there is no reduction in the cost of the cabinet BDUK paid for and there is no evidence of an increase in contribution from BT.
The matter remains outstanding.
@NGA
Quote “there is no reduction in the cost of the cabinet BDUK paid for and there is no evidence of an increase in contribution from BT.”
The article that you linked to earlier appears to contradict you. Why do you think that the BDUK team are wrong and you are right? What evidence do you have to contradict their statement?
@New_Londoner The article does not contradict me. It just says BDUK do not count or report overbuild. They divide the costs presented by BT by the number of BT premises contracted ignoring the overbuild.
If they reported overbuild, it would add 1.1m premises to the 5.5m.
The matter is outstanding but easily fixed.
@NGA – ‘I think you will find the cabinets were billed for in full. There are easy to find.’
Where is the list with billing details?
Passed over by BDUK funding, Fibre that is not fibre, cannot get Fixed wireless with any supplier as it requires line of sight, 4G is always less than 6Mbit useless even with a good signal, and a legally binding Ofcom USO cost of £60,000.
If you look up the definition of ‘corruption’:
“dishonest or fraudulent conduct by those in power, typically involving bribery.”
The whole set up seems like corruption, I guess the next step will be for them to send someone around (CarlT & TheFacts) to shut me up?
It really is a massive conspiracy targeted at you, personally. Some corrupt officials were paid off to ensure you were denied the £60k of taxpayer money you are evidently entitled to.
I would love to know exactly what you think is dishonest and fraudulent about the whole thing.
All I’m seeing is someone who doesn’t seem to understand the USO and who is bitter about not having a decent internet connection.
Why exactly should taxpayers fund your connection when you don’t seem interested in paying anything towards it yourself?
@Rural Fermanagh, the normalised deviancy has been unpicked in 7 Parliamentary inquiries and BDUK Value for Money have done good work within the limits of the commercial confidentiality process they had to work.
The above unwinding has enabled the Project Stratum funding request. Its original form in 2016 and then into the EFRA select committee in 2017 (Margaret Ritchie MP) and then the election agreement, whose origins can be found in actions including Fermanagh councillors.
It should come good but another inquiry is needed so England gets it Project Stratum(s) to complete works.
Simple point of order
Project Stratum is purely Northern Ireland and contract has gone to Fibrus
Nothing at all to do with England
@andrew The process by which the Project Stratum were pursued, the re-use of the Capital Deferral is the point. You can pick it up in the EFRA select Committee hearings. Look for the early exchanges of Neil Parish in the 2019 EFRA hearings.
If money is stuck in a process you need to find whatever means to get some movement to counter the bureaucratic nonsense from meeting the original objective. At least three attempts by NI Councillors before it ended up in an election agreement, but the existence of the Capital Deferral meant this was not new money but existing money from a Treasury perspective.
Where is the award to Fibrus announced?
https://www.ispreview.co.uk/index.php/2020/09/fibrus-win-contract-for-n-ireland-superfast-broadband-project.html
As for money being stuck, the few 1000 BDUK FTTP being built each month is using that money you categorise as being stuck in various projects across England.
But a changing picture is not something that everyone recognises
Andrew .. some perhaps, but that money contracted work outstanding. Numbers need to be published to verify you are assuming.
@CarlT: I pay plenty of tax and rates, and get little in return. I see plenty of others making use of the money. You yourself has described it as the 4th utility.
@JKJ: I am happy to pay towards the connection, just not a rediculous sum like £60,000! That is the equivalent of 200 years of superfast broadband at £25 per month.
@NGA: I thought the BDUK claw back funding was to be reinvested in the broadband network based on excess subsidy/compensation triggers. How is it governed and progress tracked?
@Andrew: Is the Fibrus announcement official? It does not seem to be backed up by a statement by the Department for the Economy NI or the government, although they now say mid-October, it seems to be a bit of a moving target as it was September previously.
@Fermanagh, the use of the clawback is not being tracked or reported upon, neither is the required BT capital contribution, hence the drama experienced by your local councillors trying to Stratom moving since 2016.
The debates in Stormont on Dec 6th 2016, and on 24/1/2017 the very last debate on the very last day of then Parliament debated Broadband and the pitch for clawback was referenced.
While NI ought to be sorted, England is not.
@Fermanagh I have submitted another paper to Ofcom (WLA review) and the several select committees on the potential additional normalised deviancy where it appears BT has capitalised the money it owes for cost recovery purposes without actually investing all of the Deferral in the network.
It is then seeking to charge again and recover the costs potentially a second time based on the costs being presented to you.
The matter is documented in Chapter 4 of the Sept 2019 EFRA select Committee report, but the issue was ignored in DCMS response to the Committee.
Northern Ireland Audit were looking at these events but not sure if they will report.
Shame about the 610,000 premises where they installed a sub-standard ( 24Mbs.
Levelling up, I think not
That got truncated, let me try again
Shame about the 610,000 premises where they installed a sub-standard service
below 24Mbs where the subscribers are generally paying the same as the luckier ones.
Dave, if your referring to the rural in-fill outstanding of ~600k premises in England then monies exist in the project if there is a will to do the contracting.
Outstanding Premises in Scotland are contracted. NI should be done soon and Wales is only 40k short but the monies are owed.
I think the final round of contracting should be regionally.
@NGA
Quote “Dave, if your [sic] referring to the rural in-fill outstanding of ~600k premises in England then monies exist in the project if there is a will to do the contracting”
This is incorrect. The monies, such that they are, exist within the various BDUK contracts not in the project as a whole, and are due to the local bodies, mainly county councils. I can’t see them rushing to share “their” money to build network in another local authority area when they’ve all got plenty of local priorities to fund, most of which are not broadband related.
New-Londoner – At least half the funds are controlled by BDUK and because of the level of underspend arising from the inflated costs reported by NAO in 2015, more flexibility is possible
So NI election deal ended up by-passing BDUK to Treasury but the scale of the underspends, profits from funding urban cabinets and the scale of the clawback made it possible.
There is a big opportunity to finish the job using BT so why object? It needs a little wherewithal but little more.
Failing to answer questions on the re-utilisation of clawback at the 2017 and 2019 EFRA inquiries was not good enough. There is no reason for these £100 a metre quotes given the funds available to complete works.
“superfast broadband” (24-30Mbps+) it might have been in 2012. “Superfast” it aint today! Just grossly bad value for money IMHO.
All this superfast, ultrafast, lightning fast bollocks needs ending and proper set speed standards need to be a part of every rollout where government funding is concerned.
It’s funny they call it superfast, especially since most households I visited get their internet through dsl and not fiber. And to think Romania reached speed of 80 Mbps back in 2007. That was 13 years ago. We are worse than one of the poorer countries.
Devon and Somerset phase 2 uptake appears to be going backwards, 10.13% & 9.85% in 2019, 8.31% & 11.49% in 2020. Something has clearly gone very wrong, these areas were contractually finished over a year ago, residents clearly don’t want or can’t get what’s on offer.
@GC – question for CDS? Good luck. Also why 2 areas have seen no change in 6 months.
@Guy
I’m pretty sure that the local authority is responsible for promotion of services once available, so this is almost certainly another responsibility for the incomparable CDS programme team.
@ New_Londoner
IMO the issue here is not a lack of promotion, or a lack of demand, it’s the service on offer.
As an ordinary subscriber I just feel the whole industry set-up is a shambles thanks to privatisation that doesn’t really work. Having tried unsuccessfully to get a fibre connection to our block of flats in Stockport and with my ADSL running at around 1mbps for months I went to 4G with O2. It runs at around 18 Mbps, not much but many times better than waste of space BT Openreach
When telecoms was a monopoly the service was terrible, waits of several months for a phone line were the norm, and it was illegal for customers to attach equipment not supplied by the telco. The introduction of competition has been the best thing for consumers in the last one hundred years.
You sir are spot on. Its a mixture of not having the connectivity people need to be available and the high cost of it putting folks off.
The fact we have this stupid monopoly with BT and Virgin generally calling the shots is why we’re in this stupid situation today, and guess what? they’re capitalizing on it.