Ofcom Scorecards Help Compare Big Mobile and Broadband ISPs

The national communications regulator, Ofcom, has today partnered with the UK Regulators Network (UKRN) to publish a series of new scorecards that are intended to help customers compare several key areas from the largest broadband ISPs, mobile and phone providers. But what of smaller providers? Forget about it.
The scorecards, which are being published alongside Ofcom’s annual Pricing Trends report, also include data from the Consumer Council for Water, FCA, Ofgem and Ofwat. In summary, they allow people to compare providers by overall satisfaction, complaints to Ofcom per 100,000 subscribers and a Net Promoter Score. Mobile operators are also given a satisfaction score for value of money.
The eagle-eyed among you will no doubt be aware that it’s already possible to get these results from existing reports, although Ofcom has now collected them together and thus made the information easier to find. Overall the regulator notes that most people are happy with the service they get, with satisfaction in the mobile, broadband and landline markets now at 93%, 86% and 83% respectively.
Advertisement
We should point out that the overall average performance scores below relates only to the providers included in the analysis (those with at least a 4% market share). BT Mobile didn’t quite meet this inclusion criteria and so some of their fields are blank (same for KCOM and Post Office in the broadband and landline category).
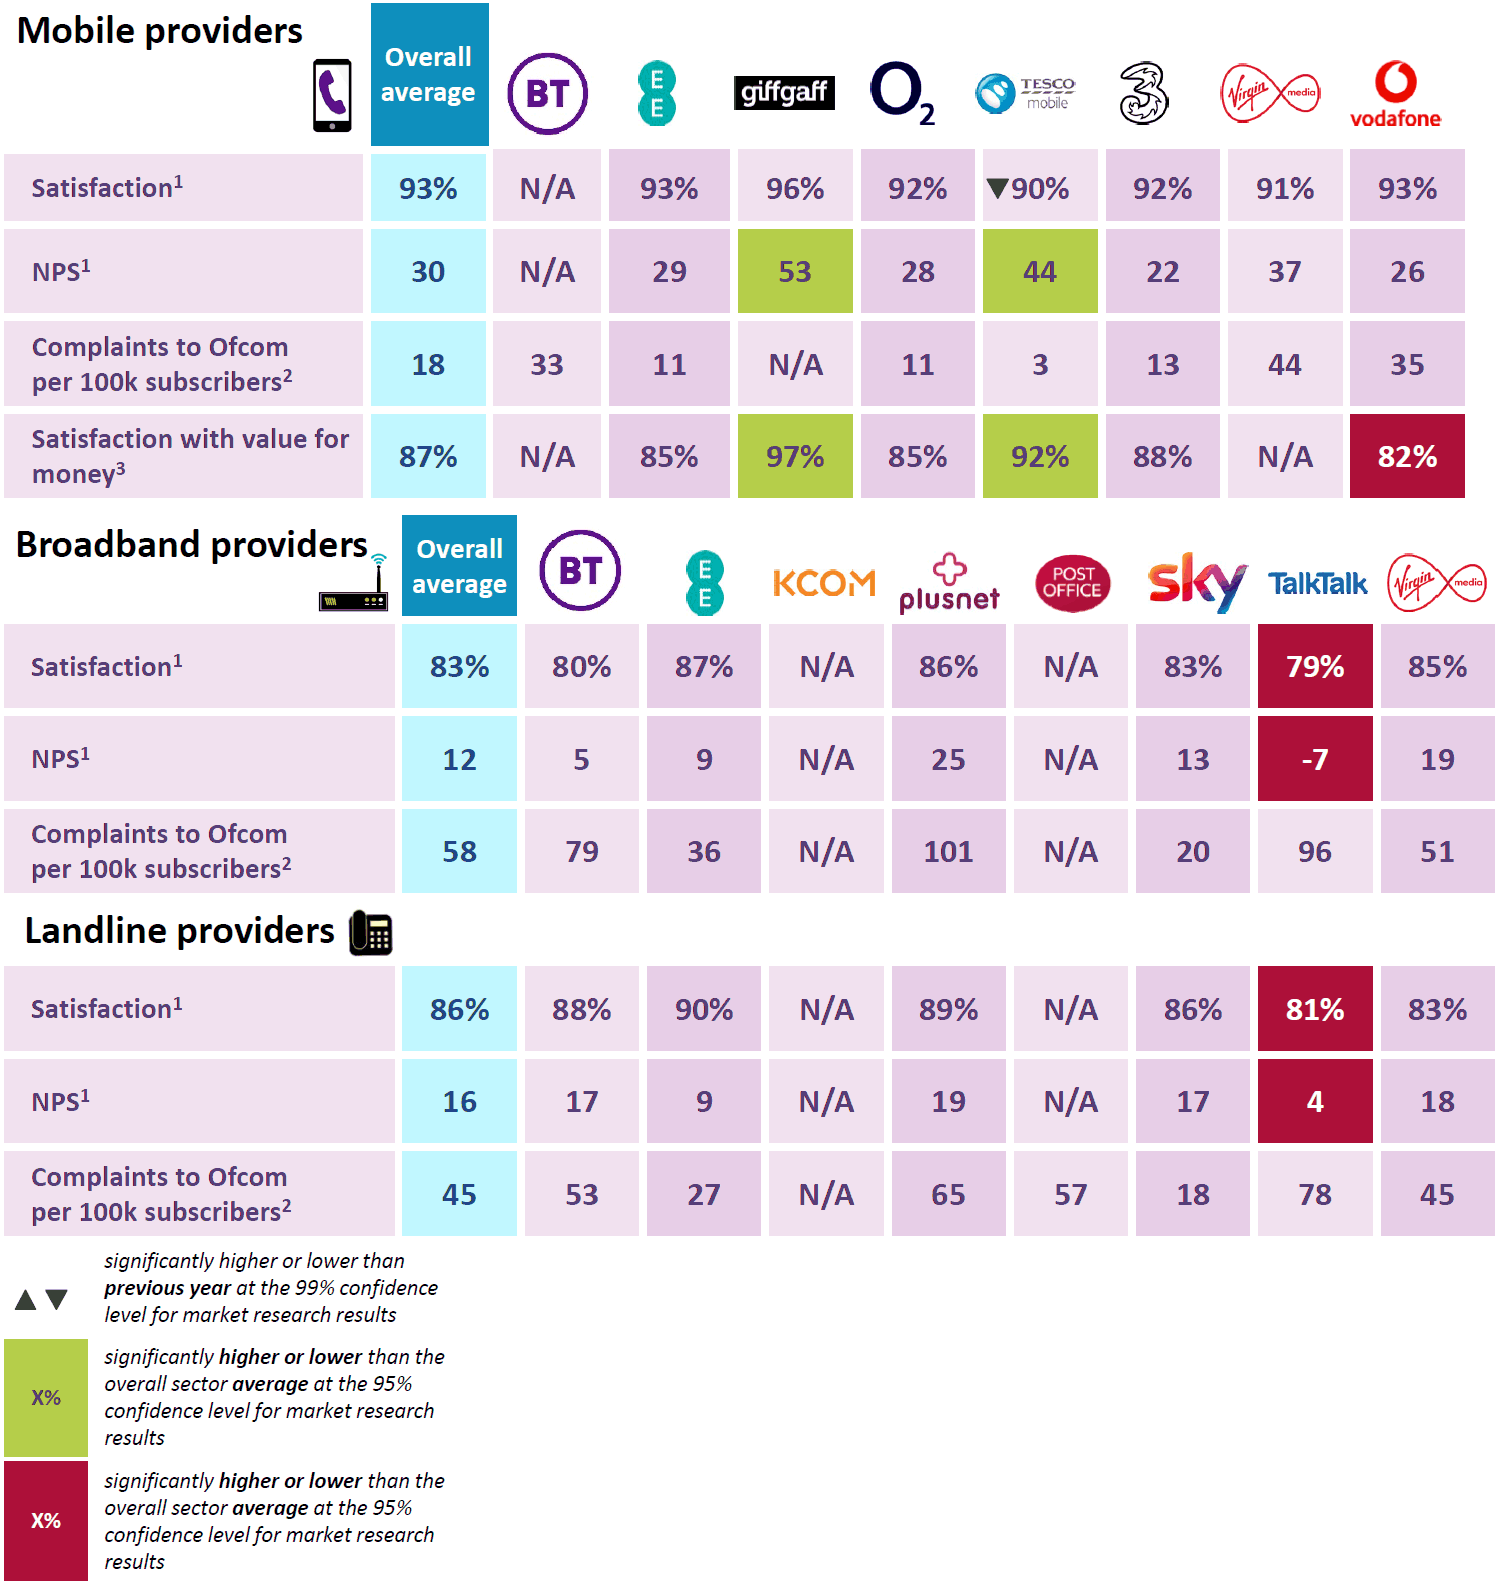
As usual TalkTalk seems to languish at the bottom of the big boys table. Otherwise you can read the full report here (pdf), including results for providers in other sectors.
Lindsey Fussell, Ofcom’s Consumer Group Director, said:
“When you’re shopping around for a phone or broadband provider, there are lots of different things to think about – from price to the quality of service you’re likely to get. These scorecards help you easily compare how different providers perform, so you can choose the right service for you.”
The biggest flaw in these “scorecards” is that they’re only based on a limited set of metrics and only look at the largest consumer providers, which for good or ill ultimately ignores literally hundreds of smaller providers (due to a lack of sample data). Nevertheless the more data consumers have access to the better and on that front this is a positive development.
Advertisement
We’ve also included a quick summary from the new 2020 Pricing Trends report below. Take note that the average price comparison with other European countries relates to dual-play and triple-play services. In addition, out-of-contract pay-monthly mobile customers includes people with bundled contracts, split contracts and SIM-only contracts with a minimum term of 12 months or more.
Key Pricing Trends Findings
The price of mobile services continues to fall.
Mobile customers in the UK pay less than those in France, Germany, Italy, Spain and the US, with the cost of average mobile call, text and data use now £13 per month – £2 lower than in 2018. Cheaper deals are becoming more popular, with 38% of all mobile customers now on SIM-only, up from 34% the previous year. The cost of mobile tariffs with higher data allowances has also fallen, while mobile data use has risen sharply – showing our mobile phones are becoming cheaper to use for the things that matter to us the most.Switching to save.
Some customers are still paying more than they need to. For example, around three quarters (73%) of mobile customers who have passed their initial deal could pay less by switching to a SIM-only deal – saving an average of £11 per month. While out-of-contract broadband customers can save £8-10 per month by taking up a new deal. In the last year, we have seen more people move to faster broadband deals, with take-up of superfast broadband increasing by a fifth. Switching among pay-monthly mobile customers has increased by a third.Mobile customers typically pay a lower overall price if they take a SIM-only deal.
Our research finds that using a SIM-only mobile service with a separately acquired handset is cheaper than buying a smartphone bundled with an airtime contract. Bundled contracts were equivalent to the customer being charged an APR (annual percentage rate) of 13-24% for their handset. The additional cost can be much higher if customers do not move onto a SIM-only deal at the end of their contract.
Mobile prices in the UK compare well to those in other countries. Our analysis compares UK pricesPeople buying bundles pay lower prices.
80% of UK households buy more than one communications service from the same provider, in line with last year. Those that bundle two or more services pay less than those who buy their broadband, phone and TV services separately. In general, the more services that are bundled together, the more people save.List prices for dual-play landline and fixed broadband services have been broadly stable since the end of 2018.
This is despite significant increases in average data use, indicating that people are getting more for their money. Basic superfast dual-play list prices are around £7.50 per month higher than for those of the equivalent standard broadband services, while promoted prices are on average £5 per month higher for superfast services.Prices for landline calls and call bundles continue to increase.
Although the rate has slowed slightly. At the same time, average line rental charges have declined in real terms, and reduced price line rental services are available to people that do not use fixed broadband.Engaged customers tend to get better deals.
But some customers lack confidence with finding the best deal for them, such as understanding the language and terminology or comparing costs. Despite the benefits of engaging, our research finds 28% of fixed broadband customers, and 35% of mobile customers, are “apprehensive” about doing so.Forty-one per cent of broadband customers are out-of-contract.
Based on customer-level data collected in November 2018 and reported in our review of pricing practices in fixed broadband. Prices usually increase for those who do nothing at the end of their contract: they pay an average of £9-10 per month more than new customers and £8-9 more than those who re-contract.


Mark is a professional technology writer, IT consultant and computer engineer from Dorset (England), he also founded ISPreview in 1999 and enjoys analysing the latest telecoms and broadband developments. Find me on X (Twitter), Mastodon, Facebook, BlueSky, Threads.net and Linkedin.


« 4,500 Homes in Houghton-le-Spring Get Virgin Media Full Fibre
BT and ATEME Move to Tackle Streamed TV Broadcasting Piracy »


I haven’t a clue how GiffGaff has 96% customer satisfaction.