Opensignal Rate UK Broadband ISPs by Quality and Speed

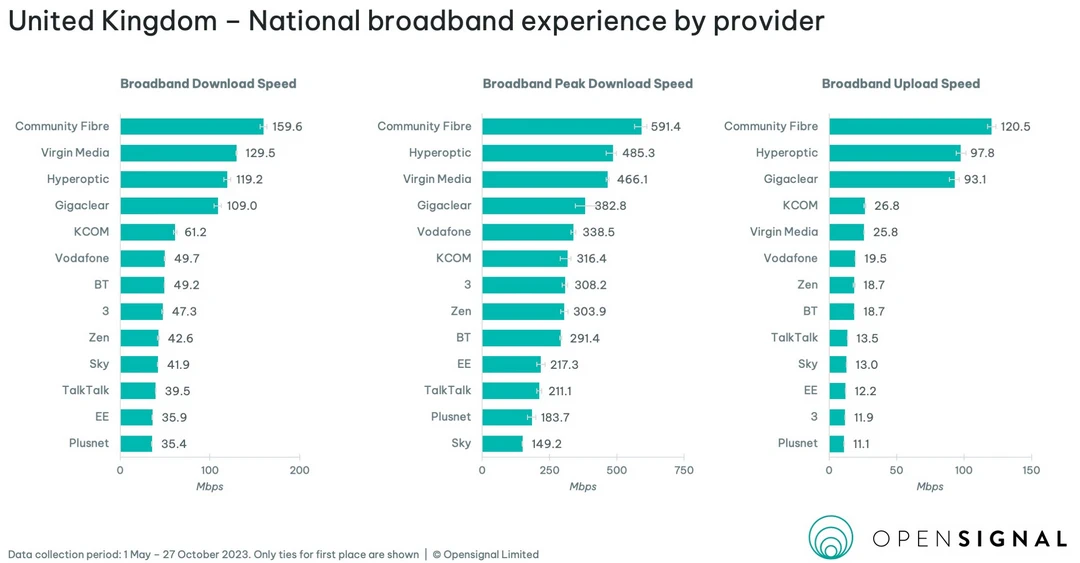
Benchmarking firm Opensignal has today published a supposedly “definitive” study of fixed broadband speeds across the United Kingdom, which reveals which ISPs are delivering both the best service quality and speeds to consumers. Perhaps unsurprisingly, the table ends up being topped by CommunityFibre, Virgin Media and Hyperoptic etc.
The following results are based on crowdsourced data collected from consumer speedtests. Due to this there are some caveats to consider because such testing can be impacted by a lot of variable factors, such as poor home wiring (ADSL and FTTC lines), the end-user’s choice of package (e.g. 1Gbps could be available, but people may pick a slower / cheaper tier), local network congestion and slow home WiFi performance etc.
On top of that, it’s fair to say that ISPs with a higher proportion of customers on ultrafast (100Mbps+) or even gigabit (1Gbps+) tiers will naturally do better in reports like this, while ISPs with a larger pool of customers stuck on legacy broadband connections (e.g. ADSL, FTTC) will be pulled down the table – even if their own full fibre tiers actually perform quite well. This is partly why CommunityFibre, Virgin Media and Hyperoptic do so well below.
Advertisement
Put another way, studies like this are only really useful for observing general market change over time and perhaps shouldn’t be taken as a true reflection of either network capability or network availability. Opensignal also further clouds their results by choosing to include scores from Three UK’s mobile network, which has the additional effect of creating uncertainty around the results for Vodafone and EE (they do both fixed and mobile).
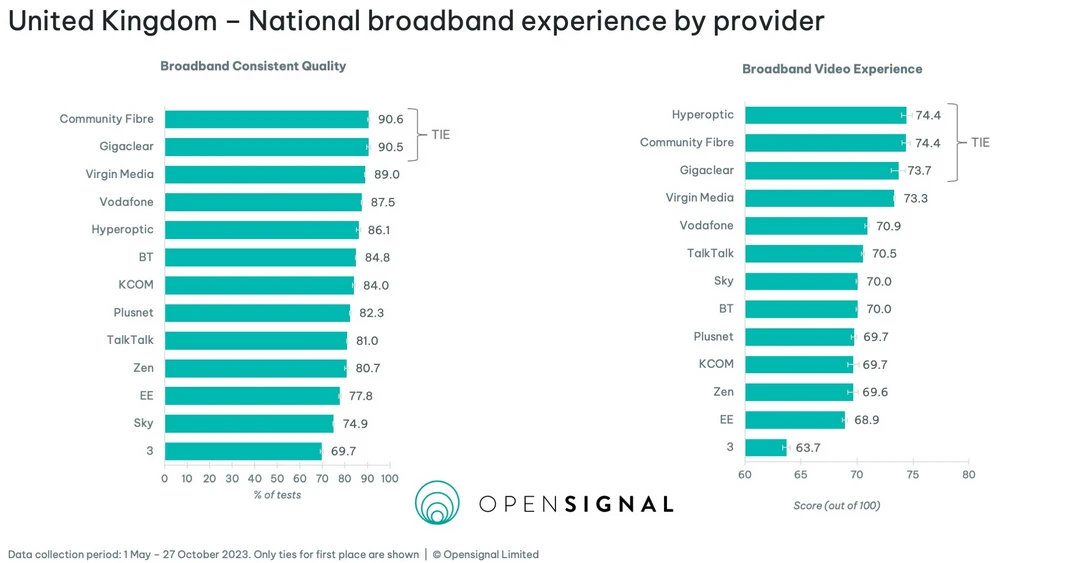
On the other hand, Opensignal’s decision to factor in all broadband technologies and define them as “fixed broadband” solutions does make for an interesting comparison, particularly as we can see that Three UK manages to beat some of the market’s most established fixed-line ISPs when it comes to raw service speed. But the story changes when providers are ranked by service quality, which pushes Three UK to the bottom of the pile.
Advertisement
Take note that Opensignal defines their ‘Broadband Consistent Quality‘ metric as using six key performance indicators, including download and upload speed, latency, jitter, packet loss and time to first byte. The metrics are represented as a percentage of users’ tests that have met the minimum recommended performance thresholds to watch HD video, complete group video conference calls and play games. Broadband Consistent Quality is measured across all users in all hours of the day. This may help to explain why the more variable environment of Three UK’s mobile network could be doing them a disservice above.
The report also makes this rather unusual statement: “Because there are no truly national fixed broadband providers in the U.K. we have included regional players such as KCOM (Hull, East & North Yorkshire and North Lincolnshire) and Community Fibre (London) — along with rural-focused Gigaclear — in the national results to better reflect the reality of the U.K.’s broadband market.” We suspect that ISPs on Openreach’s network may disagree with the “no truly national” remark, since they reach around 30 million premises across ADSL, FTTC and FTTP technologies.
The full report also examines the performance of these providers across the cities of London, Belfast, Cardiff, Edinburgh and Manchester. Virgin Media seems to come top in most of those, except London where CommunityFibre’s FTTP network is able to beat everybody, although Virgin Media and Hyperoptic remain in contention (except for uploads, where Virgin Media is quite weak due to their legacy HFC lines).
Overall, this is an interesting report, albeit one that would benefit from a bit more segregation between technologies and the removal of mobile connectivity to avoid confusion.
Advertisement
Mark is a professional technology writer, IT consultant and computer engineer from Dorset (England), he also founded ISPreview in 1999 and enjoys analysing the latest telecoms and broadband developments. Find me on X (Twitter), Mastodon, Facebook, BlueSky, Threads.net and Linkedin.
« Openreach List 142 New UK Locations for FTTP Broadband Build














Also doesn’t seem to take into account time-of-day. Averages are also very misleading. A measure like 99th percentile would be more useful.
Should report by minimum guaranteed speeds – that would help see the trees from the woods, and year on year as they are gettin gworse by my locale, 30% this year – there does not seem to much of this in all the glossy great publicity of digital britain – for some reason?
I’m surpirsed another Alnet ISP didn’t sneak in one or two of the listed graphics along side Community Fibre who are basically only in London from what I can tell. Even on the regional breakdowns I still can’t see any.
Is there any mention of who commissioned the report? CF would be the likely candidate but not to say anything here isn’t factually accurate. Useful bit of marketing which shows what FTTP can achieve.
I also say this when looking in to isp reviews here on isp review , Could be solved by simply different reviews based on what type and speed you have .Mixing in fttc with fttp paints a nasty comparison and is mis-leading to how a isp may preform .
(such testing can be impacted by a lot of variable factors, such as poor home wiring (ADSL and FTTC lines), the end-user’s choice of package (e.g. 1Gbps could be available, but people may pick a slower / cheaper tier), local network congestion and slow)
These figures are a bit useless, they give no real indication of which provider is better or worse.
The survey tells nothing really meaningful